






 |
| Gold V.1.3.1 signal Telegram Channel (English) |
WTI Crude Oil Surges Amid Middle East Tensions: Key Technical Patterns Unfold, July 23, 2026
2026-07-23 @ 06:03
Over the past 24 to 48 hours, WTI Crude oil prices have experienced notable volatility, closing at $86.83 on July 22, up $1.92 from the previous day. This surge was primarily driven by escalating geopolitical risks in the Middle East. Reports indicate accelerated progress on pipeline projects aimed at bypassing the Strait of Hormuz amid rising tensions, heightening concerns over potential supply disruptions.
Moreover, despite mixed US stock market performance ahead of key tech earnings reports, investors reacted strongly to rising oil prices. WTI oil futures extended gains for a fourth consecutive day, underpinned by fears of supply shortages caused by ongoing US-Iran military actions and heightened conflict threats. Political rhetoric from US officials also amplified worries that Iran may not be serious about reaching a deal, pushing prices further upward.
For the average investor, this recent sharp price increase serves as a warning signal reflecting significant risks to global energy supplies amid geopolitical instability. If hostilities or tensions persist, oil prices may continue to climb in the short term, fueling strong volatility across energy stocks and commodity markets. Keeping a close watch on Middle East developments and diplomatic relations between the US and Iran will be critical in forecasting future oil market direction.
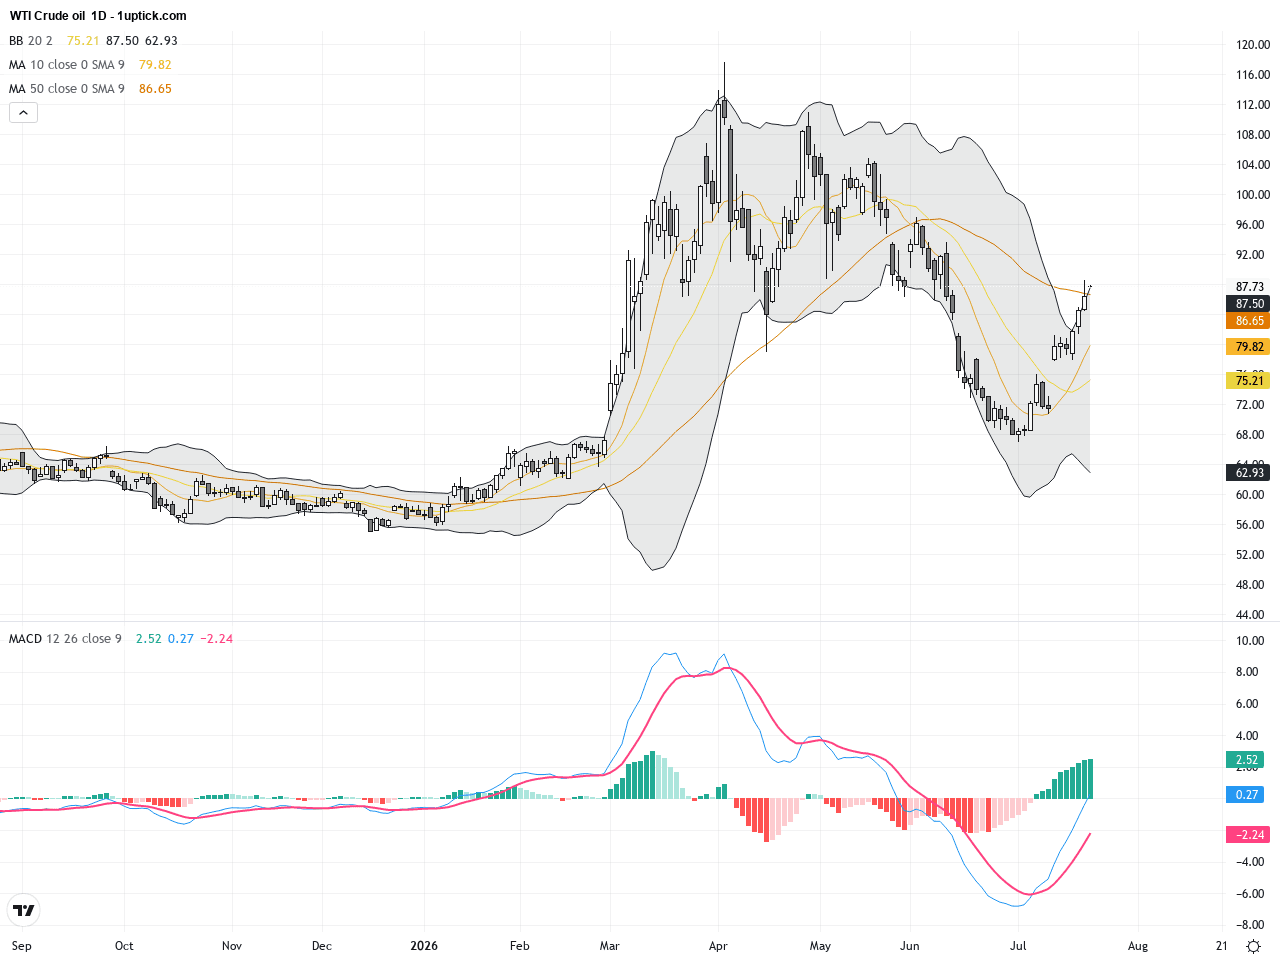
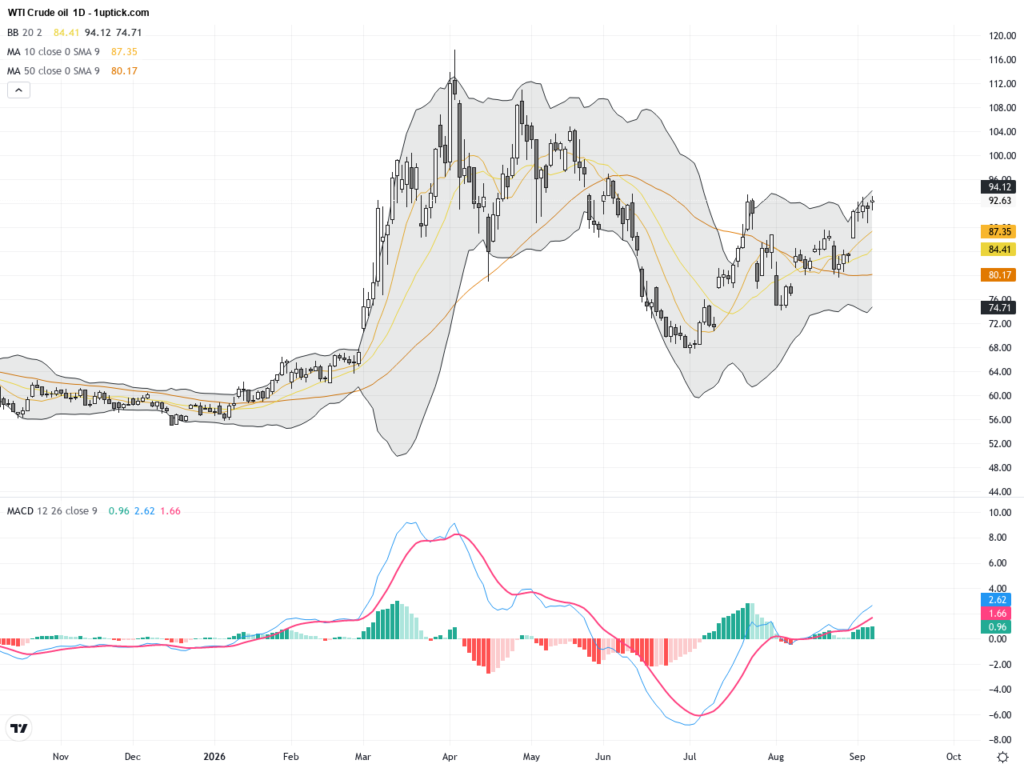
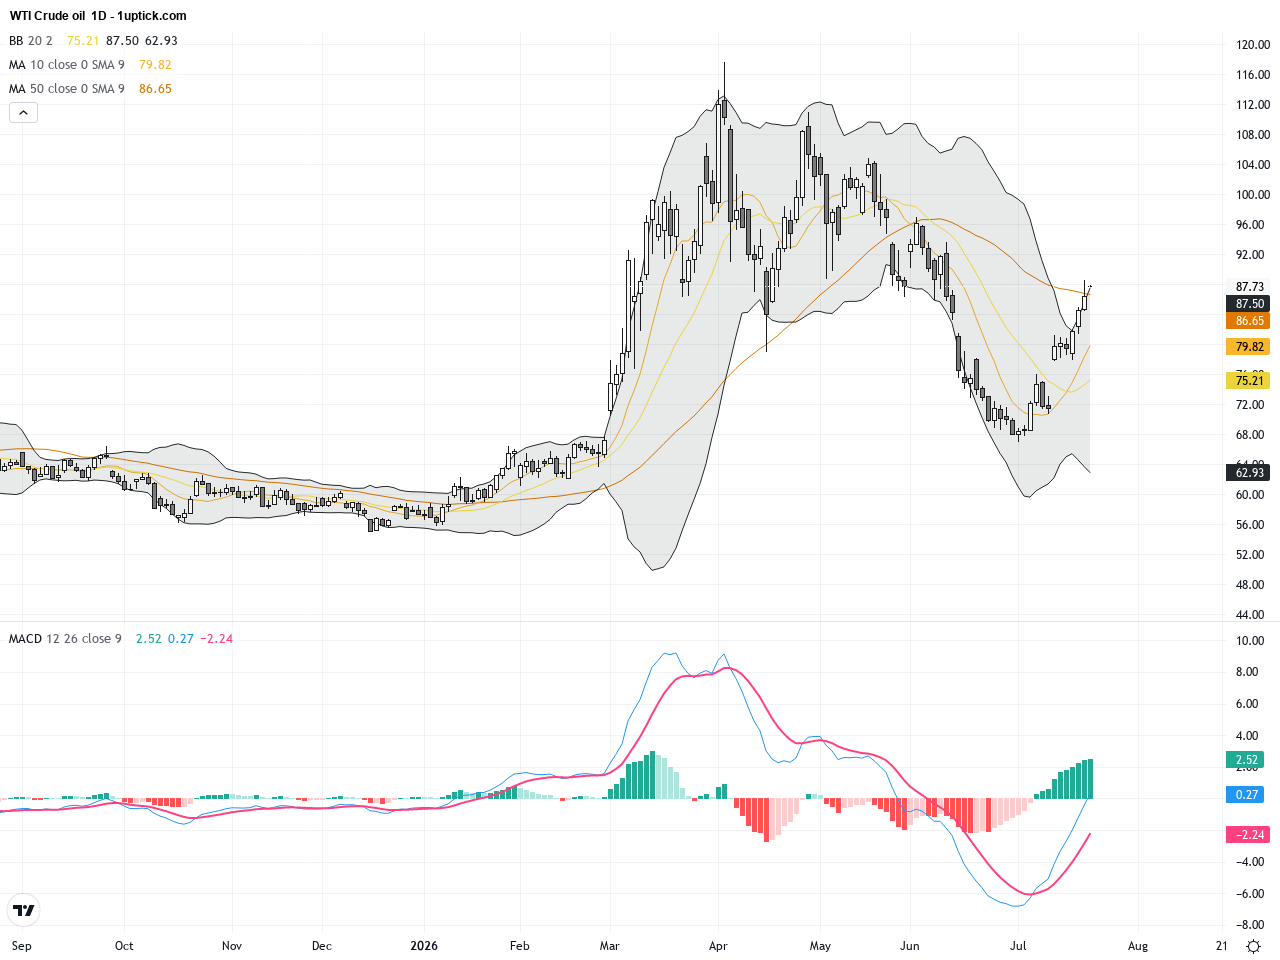
The daily chart of WTI Crude Oil shows a steady upward trend over the past month, forming a clear bullish structure. Prices started near $68 in early July, consistently making higher highs and higher lows, confirming strong buying pressure. Technical indicators like the 20-day and 50-day moving averages are positively aligned with prices comfortably above them, signaling a sustained uptrend. The Bollinger Bands are widening, indicating increased volatility, while the MACD stays bullish with the fast and slow lines diverging above the zero line, affirming strong momentum.
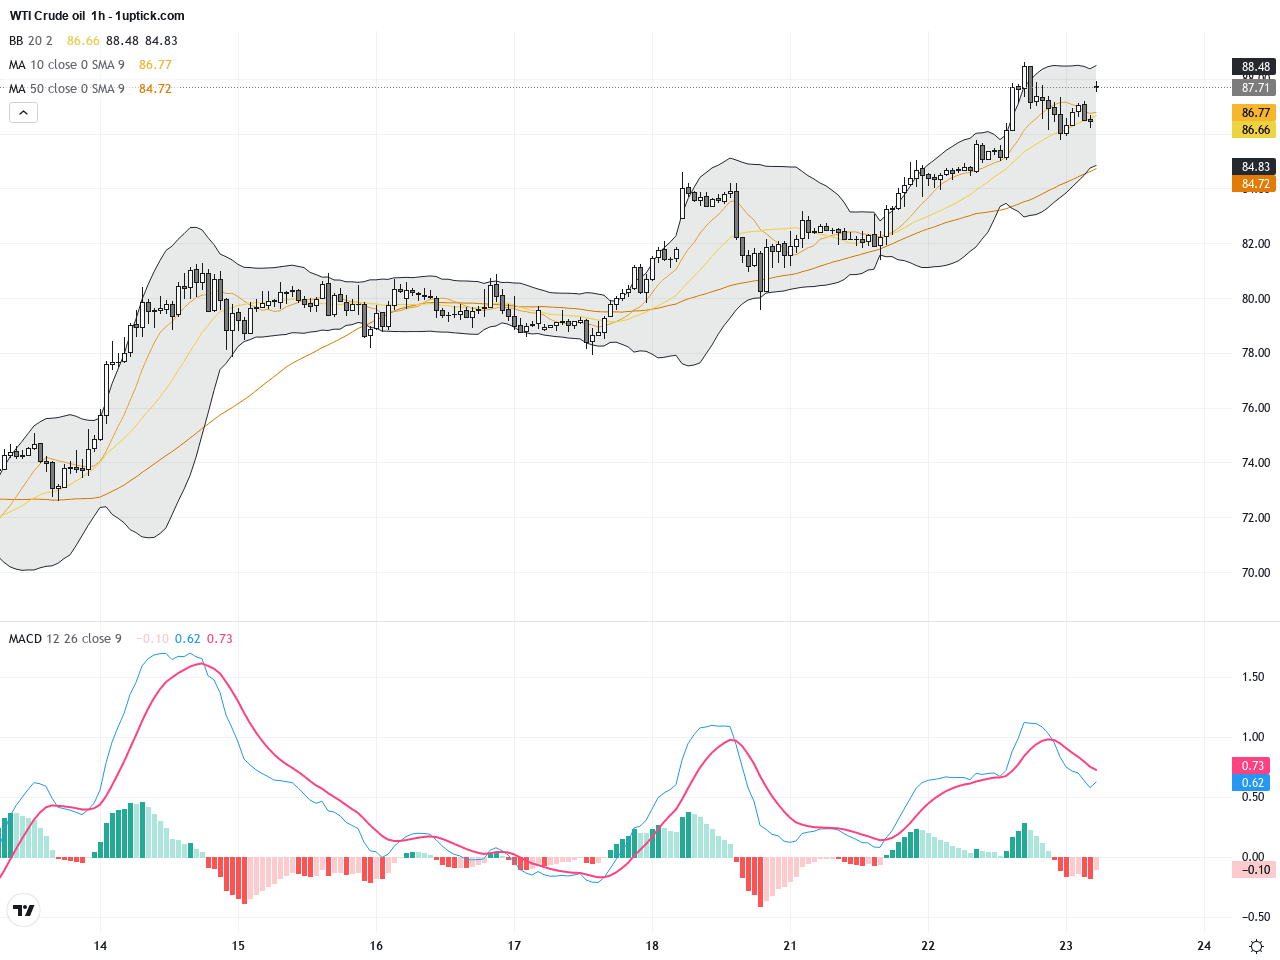
The hourly chart over the past 3 to 5 days exhibits significant short-term bullish momentum as prices break through multiple resistance levels and hover near the upper Bollinger Band. The MACD displays a bullish crossover with expanding momentum, suggesting strong buying interest. Minor pullbacks and consolidation forming small flag patterns hint at short-term corrective pauses before potential further gains. Compared to the solid daily uptrend, the hourly chart reflects more pronounced volatility and near-term opportunities for tactical entries on dips.
Technical Trend: WTI Crude Oil is currently in a decisively bullish trend, exhibiting strong and expanding upward momentum.
WTI Crude Oil’s technical setup is predominantly bullish, with the daily chart displaying a clear upward trend supported by a positive MACD and expanding Bollinger Bands, indicating sustained momentum. The hourly chart’s formation of consolidation flags suggests short-term pauses but overall trend continuation. Emerging long-term inverse head-and-shoulders patterns hint at a potential price extension if key resistances are broken. Traders should monitor volume and momentum alignment closely to gauge whether the uptrend will persist or face retracement.There are no significant or directly relevant economic events scheduled today that are likely to impact WTI Crude Oil prices. Market focus remains firmly on geopolitical developments in the Middle East, which will continue to drive supply concerns and price fluctuations.
Resistance & Support
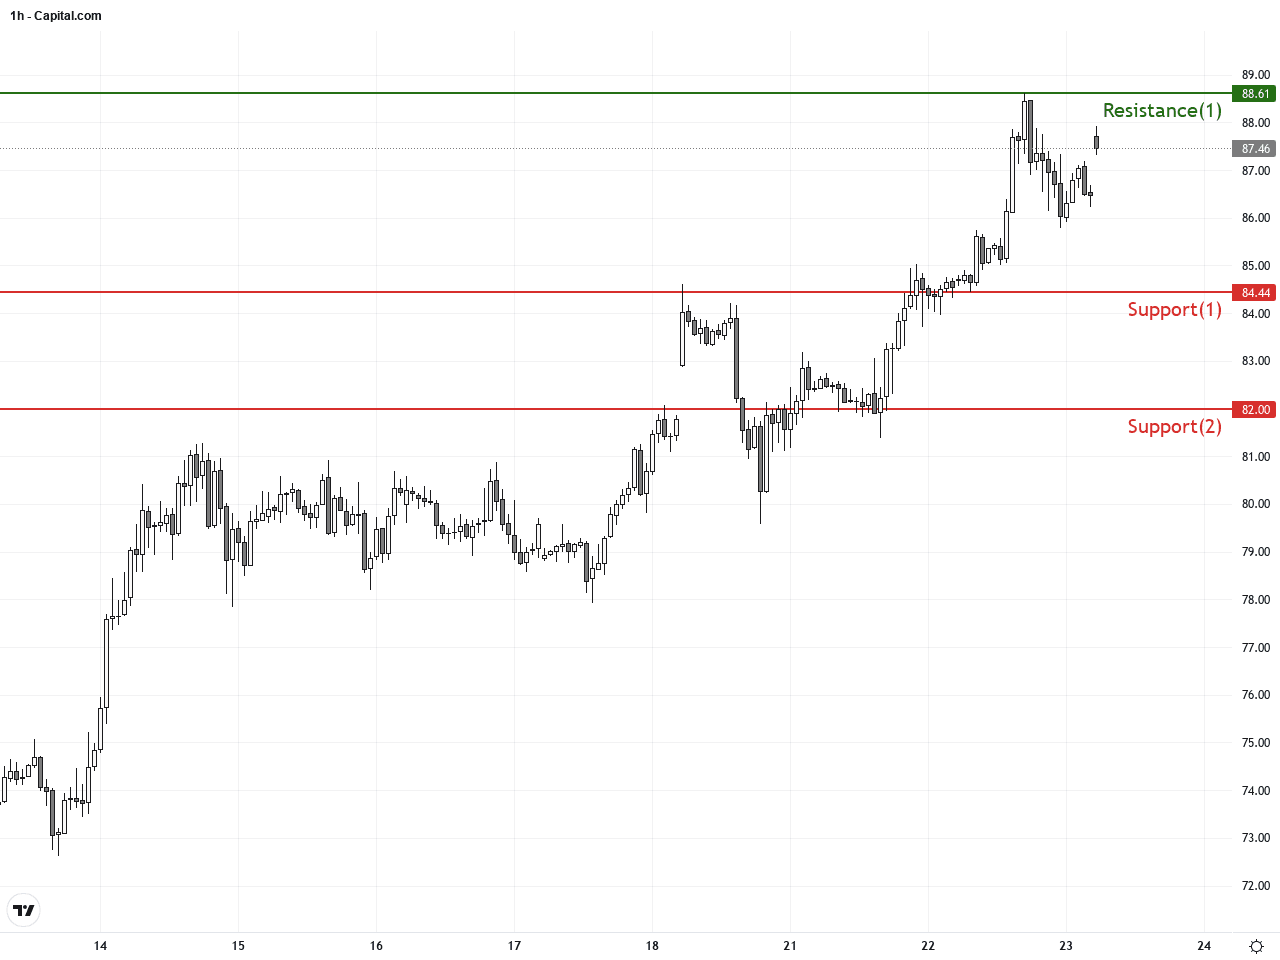
Run Live WTI Crude Oil Analysis
The above financial market data, quotes, charts, statistics, exchange rates, news, research, analysis, buy or sell ratings, financial education, and other information are for reference only. Before making any trades based on this information, you should consult independent professional advice to verify pricing data or obtain more detailed market information. 1uptick.com should not be regarded as soliciting any subscriber or visitor to execute any trade. You are solely responsible for all of your own trading decisions.