









 |
| Gold V.1.3.1 signal Telegram Channel (English) |
XAUUSD: Gold in Early Long-Term Bull Market Faces Critical 4220 Resistance, July 23, 2026
2026-07-23 @ 05:04
Over the past 24 to 48 hours, the gold market (XAUUSD) showed significant volatility, with the price rising modestly from the closing of $4130.225 on July 22 to reach a two-week high, drawing broad market attention. The surge was largely influenced by billionaire investor John Paulson’s recent declaration that gold is in the early stages of a long-term bull market, which boosted investor confidence in gold.
Meanwhile, traders are closely monitoring upcoming Federal Reserve guidance and fluctuations in oil prices, both seen as key influences on gold’s trajectory. Although resistance around the $4220 level remains a ceiling for a sustained rally, and some analysts are cautious about a strong breakout in the short term, overall bullish sentiment has been strengthened by the long-term outlook and recent price action.
For the average investor, this signals a renewed appeal of gold as a safe-haven asset. Given ongoing economic uncertainties and increased global market volatility, demand for gold as a defensive holding provides a protective cushion in portfolios. Observing market news and Fed policy shifts, investors are advised to maintain a cautiously optimistic stance and consider measured exposure to gold-related investments.
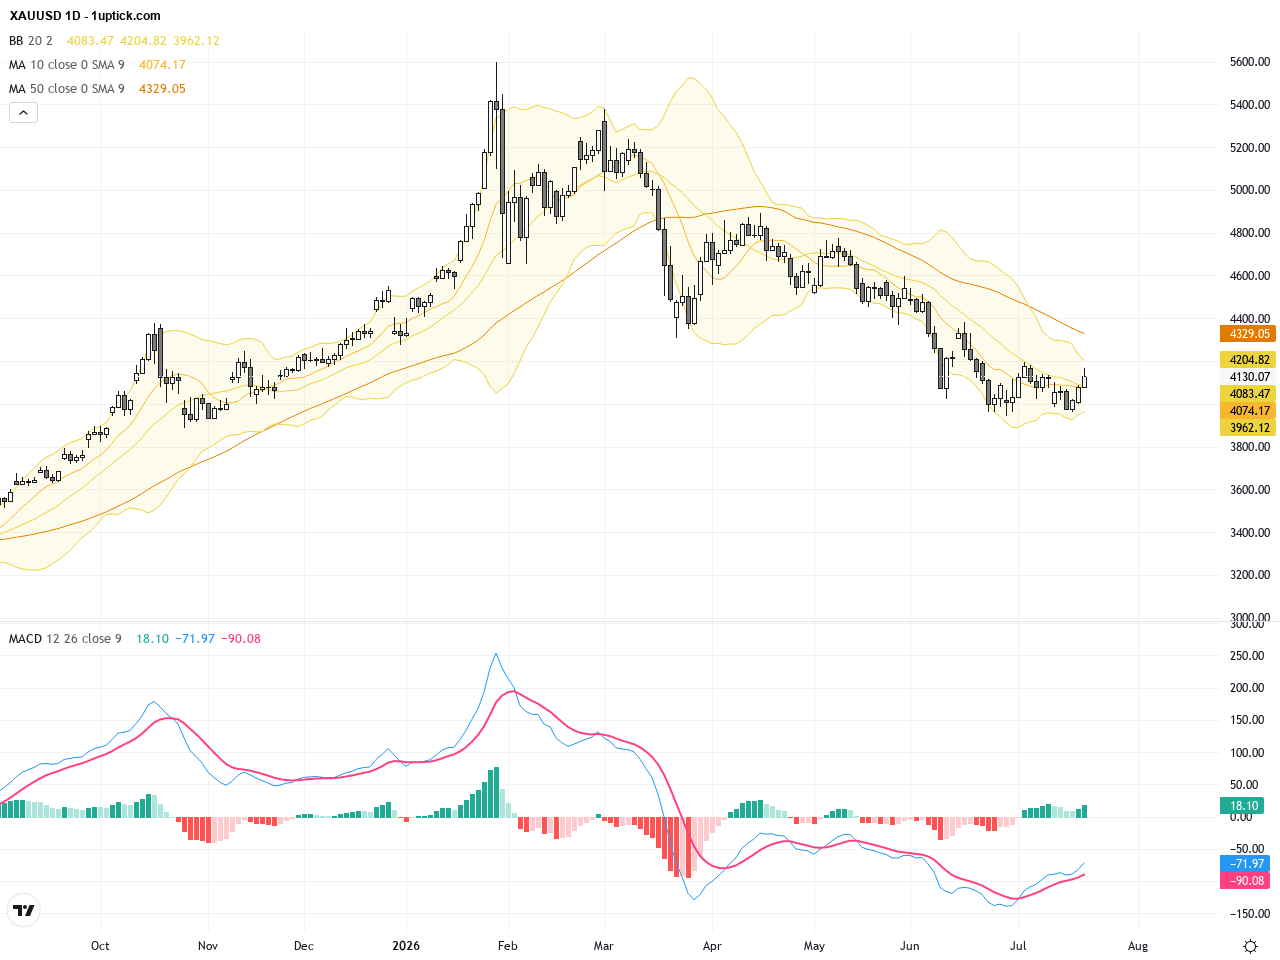
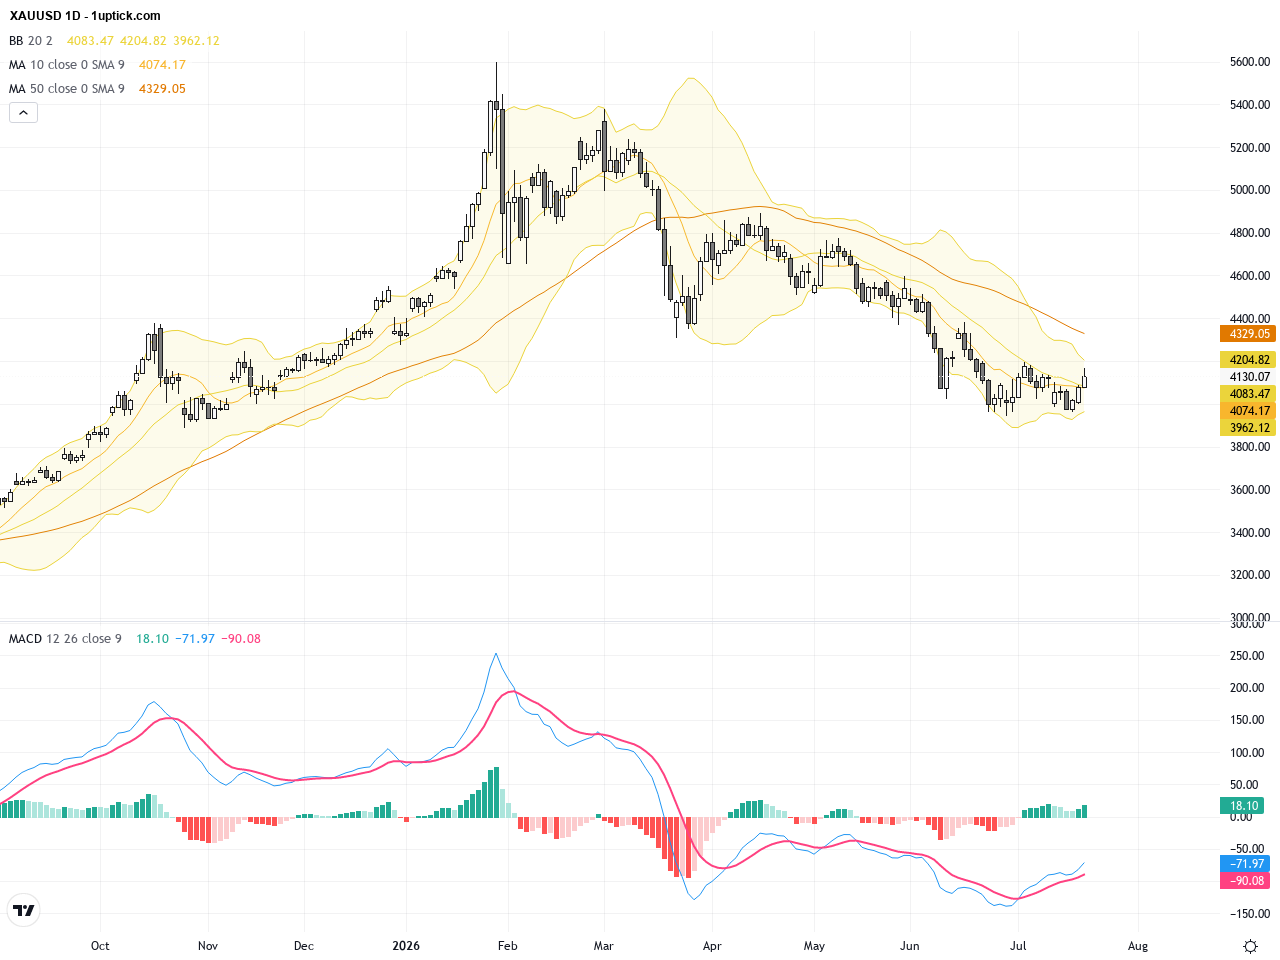
The daily chart illustrates a solid uptrend with prices steadily climbing from the late June lows near $4000. The price remains above the 50-day moving average and has recently broken above the Bollinger Bands middle band, signaling bullish momentum. MACD histogram expands, confirming strengthening upward momentum. Overall, the daily trend favors further gains with a positive market bias for gold.

On the shorter-term hourly chart covering the last 3-5 days, gold has risen gradually from about $4040 to near $4130, forming a stepwise upward pattern. The price is hovering near the upper Bollinger Band, indicating possible short-term overbought conditions. MACD shows a mild bullish crossover but shrinking histogram bars hint at waning momentum. A small flag pattern is forming; a breakout above it would signal continuation, while failure could lead to a pullback towards the $4100 support area.
Technical Trend: Overall trend shows a strong and steady uptrend with short-term sideways consolidation, warranting cautious optimism.
Technical analysis indicates XAUUSD remains in a clear uptrend, with the 50-day moving average providing solid support and MACD in bullish mode. Bollinger Bands show price expansion potential. However, short-term momentum indicated by hourly charts shows mild loss of strength with a flag consolidation pattern, suggesting some pause or pullback may precede another attempt to test resistance. The recent bullish engulfing daily candle suggests gold will likely remain strong over the next 24 hours but must overcome key resistance levels.Today’s GMT+1 economic calendar highlights Japan’s widening June trade deficit and strong export/import growth, which could weaken the JPY and indirectly support USD-priced gold. UK inflation data signals moderate easing, likely keeping GBP steady and having limited impact on gold. US crude oil inventory data released later could influence USD safe-haven flows and add slight volatility to gold price. No major direct USD economic events are scheduled today, leading to mild overall impact on XAUUSD.
Resistance & Support

The above financial market data, quotes, charts, statistics, exchange rates, news, research, analysis, buy or sell ratings, financial education, and other information are for reference only. Before making any trades based on this information, you should consult independent professional advice to verify pricing data or obtain more detailed market information. 1uptick.com should not be regarded as soliciting any subscriber or visitor to execute any trade. You are solely responsible for all of your own trading decisions.