









 |
| Gold V.1.3.1 signal Telegram Channel (English) |
AUDUSD: Key Technical Resistance Challenges and Trading Outlook Amid Market Uncertainty, July 24, 2026
2026-07-24 @ 06:01
Over the past 24 to 48 hours, the AUD/USD pair experienced mild downward pressure, closing yesterday at 0.69683. Despite stronger-than-expected Australian employment data that should have supported the Australian dollar, the ongoing strength of the US Dollar weighed on the pair, causing it to trade slightly lower around 0.6966, down roughly 0.45%.
Market attention recently centered on Australia’s jobs figures and escalating geopolitical tensions in the Middle East, which have heightened expectations for oil prices and rate hikes, influencing investor risk appetite toward the AUD. Although the Reserve Bank of Australia’s hawkish stance provided short-term support, the Federal Reserve’s rate outlook kept the US Dollar robust, leaving AUD bulls struggling below the 50-day moving average to regain upward momentum.
For the average investor, the situation resembles a tug-of-war: Australia’s economic fundamentals present a positive backdrop, but external uncertainties, including geopolitics and US economic data, continue to drive volatility. This underscores the need for caution when holding AUD-related assets amid the current global macro environment, with keen attention on upcoming jobs data and shifts in market risk sentiment.
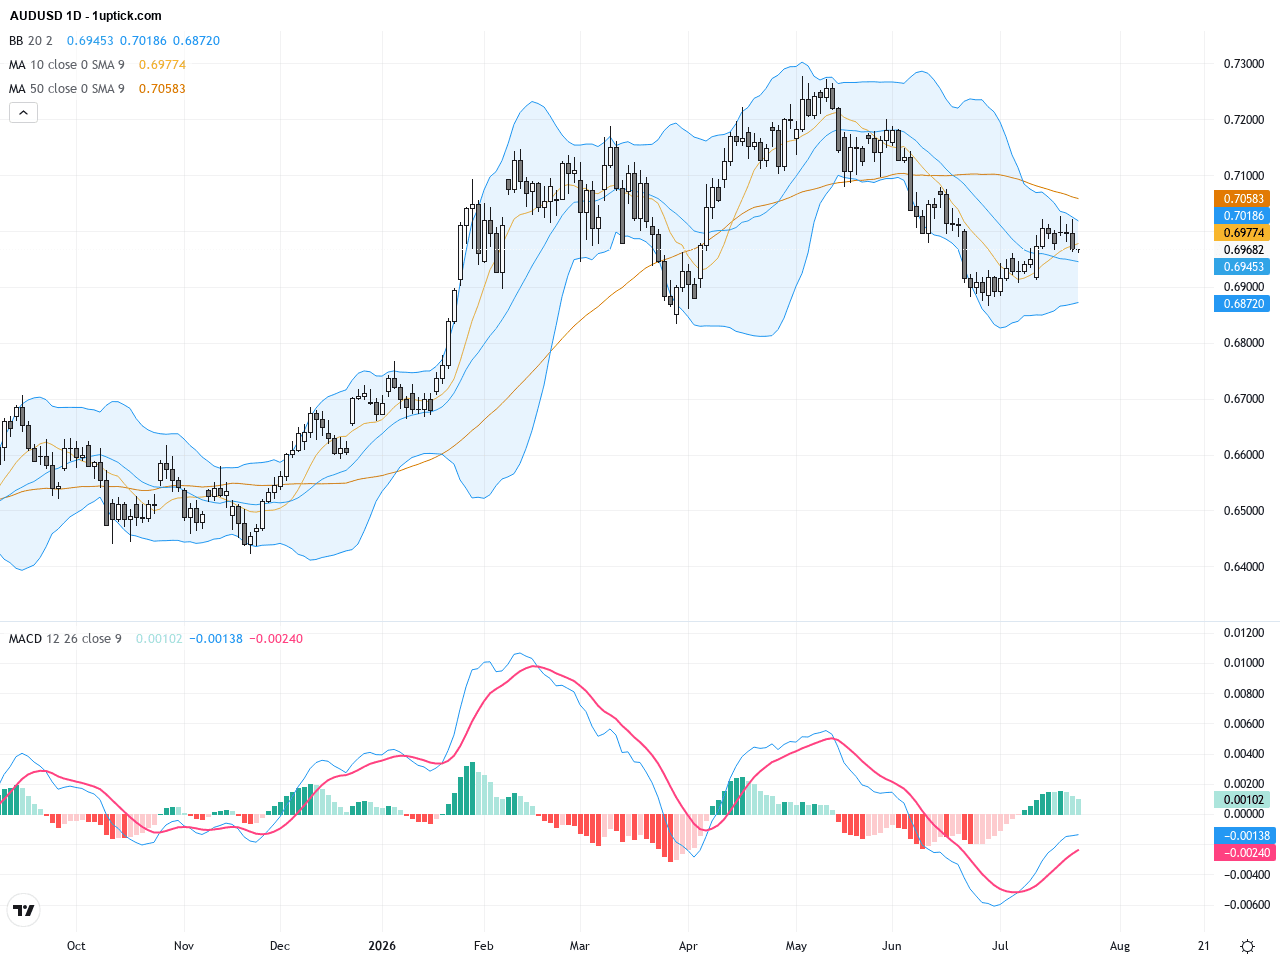
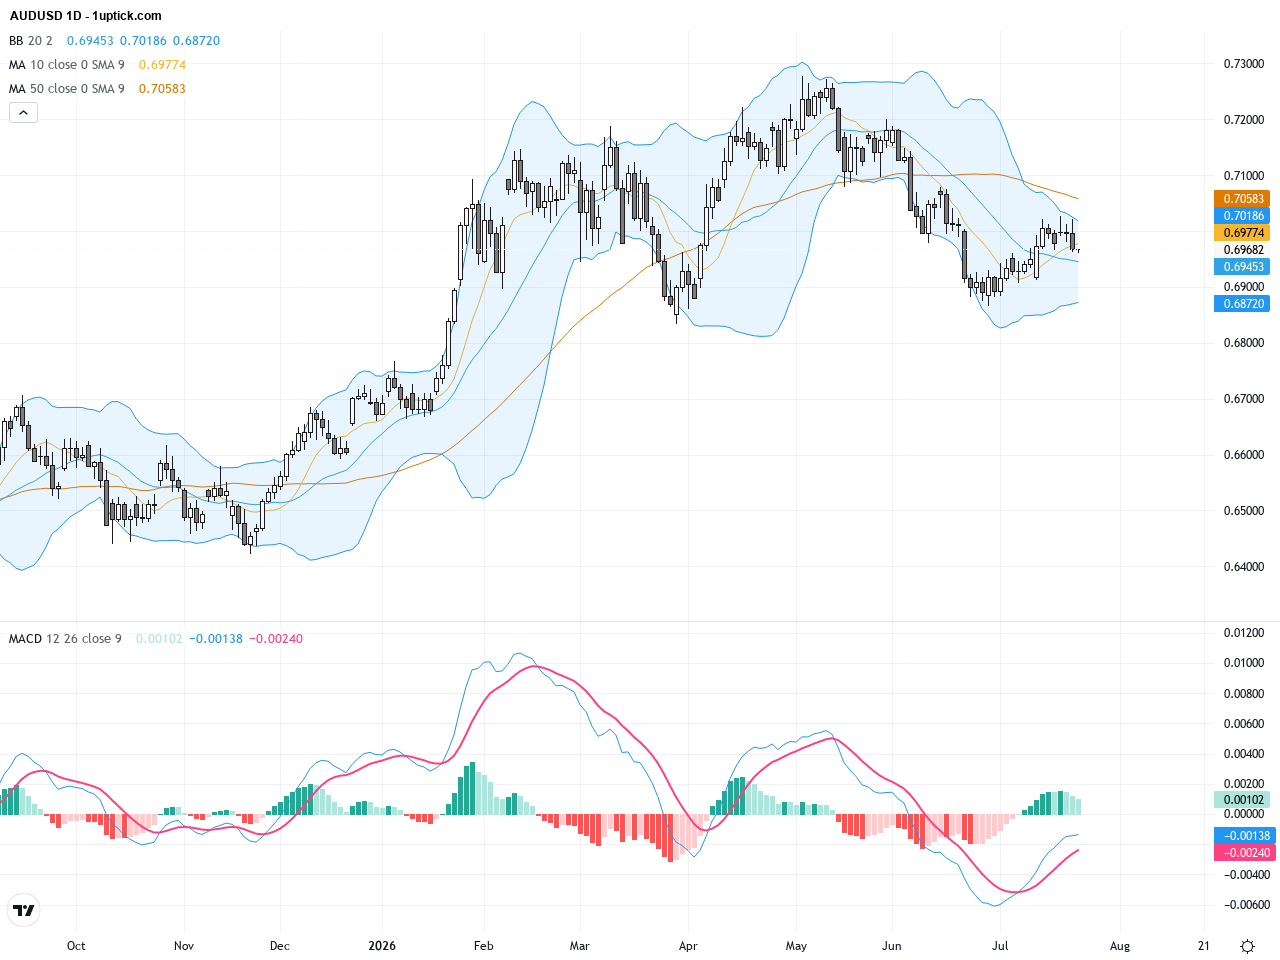
The daily chart shows AUDUSD in a sideways to slightly downtrend movement since its recent highs, struggling below the 50-day SMA. Price currently hovers around the 200-day EMA near 0.6966, which acts as a crucial support zone. Bollinger Bands suggest subdued volatility centered near the midline, and the MACD exhibits a slight bearish tilt, indicating downward momentum without a clear sell-off. Overall, the daily trend remains fragile with potential downside risks if the 50-day SMA resistance holds.
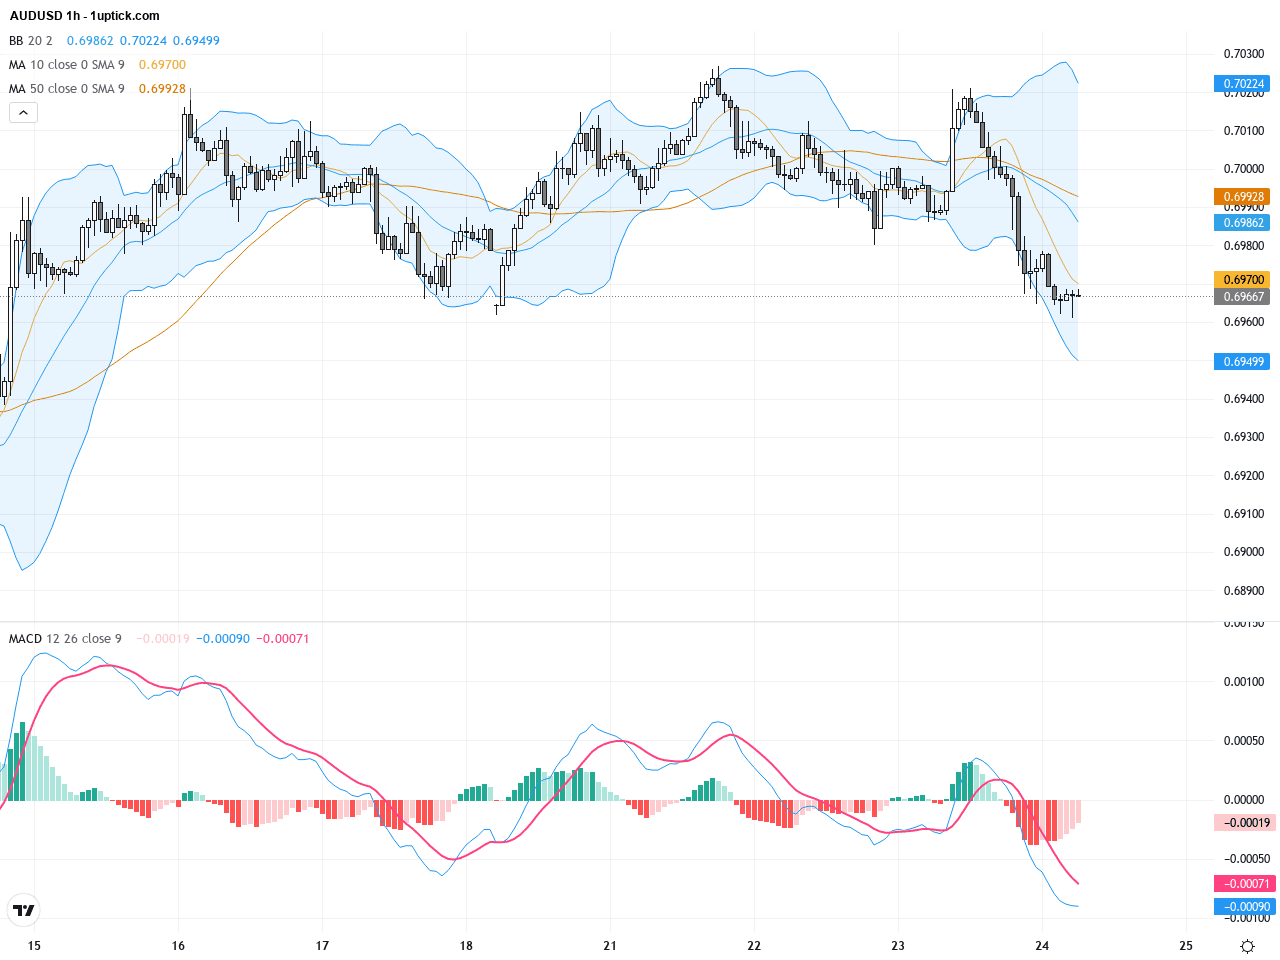
The hourly chart over the past 3-5 days reveals consolidation between 0.6958 and 0.6980, with short-term moving averages frequently crossing, reflecting indecision. Bollinger Bands have narrowed, signaling reduced volatility. The MACD is near a bearish crossover, and RSI is trending below neutral, signaling waning bullish momentum. A descending triangle pattern has emerged recently, often a bearish continuation signal. A bearish engulfing candlestick indicates increased selling pressure within the last 24 hours, warning of a possible break below 0.695 support.
Technical Trend: The short-term trend is cautiously bearish, with the pair trapped in a weak consolidation phase as market participants await fresh data to trigger directional momentum.
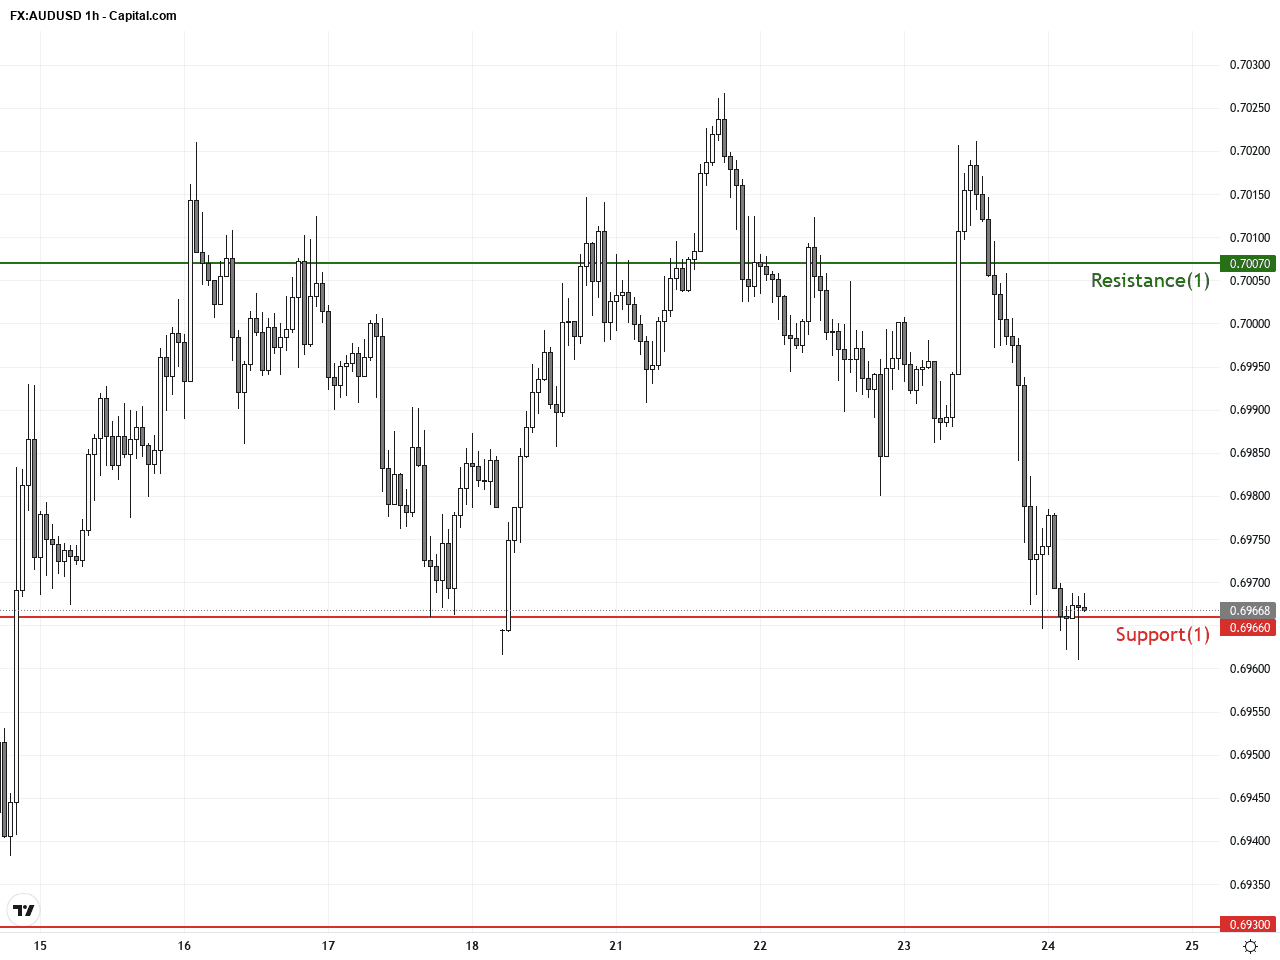
Technically, AUDUSD is currently facing resistance at the 50-day SMA with volume and volatility tapering off, forming a consolidation pattern. The potential bearish MACD crossover and the descending triangle pattern suggest a higher probability for downside moves ahead. Key support and resistance levels will determine breakout directions. Short-term traders should use these technical cues to define tight stop losses and manage risk accordingly.Today’s economic calendar highlights key releases from Japan and Europe, including Japanese CPI and core CPI, as well as multiple July manufacturing and services PMIs across Europe. However, these events have limited direct impact on AUDUSD. Current market focus remains on US labor data and commodity price movements. Overall, no major direct economic event scheduled today is likely to cause immediate moves in AUDUSD, so traders should watch for upcoming significant catalysts.
Resistance & Support
The above financial market data, quotes, charts, statistics, exchange rates, news, research, analysis, buy or sell ratings, financial education, and other information are for reference only. Before making any trades based on this information, you should consult independent professional advice to verify pricing data or obtain more detailed market information. 1uptick.com should not be regarded as soliciting any subscriber or visitor to execute any trade. You are solely responsible for all of your own trading decisions.