









 |
| Gold V.1.3.1 signal Telegram Channel (English) |
XAUUSD Gold: Critical Support Holds Amid Volatile Trading, Eyeing Key Resistance Break, July 24, 2026
2026-07-24 @ 05:04
Over the past 24 to 48 hours, gold (XAUUSD) experienced notable volatility, closing yesterday at $4049.43, down from the previous day’s highs. The market was driven by Brent crude oil topping $100 and the US 10-year Treasury yield surpassing 4.707%, pushing September Fed rate hike odds up to 80%. These dynamics put downward pressure on gold prices.
Recent reports highlight that gold is in the early stages of a long-term bull market, supported by billionaire investor John Paulson’s bullish stance. The upcoming ECB and Fed meetings add layers of uncertainty and support to gold’s safe-haven demand. Despite short-term pressures, gold has managed to hold above $4100, though close monitoring of macroeconomic policy shifts remains essential.
For the average investor, when oil prices surge alongside rising interest rates, gold’s safe-haven appeal competes against the lure of higher-yield assets, often causing pressure on gold prices. Understanding these market forces helps investors fine-tune their portfolio strategies accordingly.
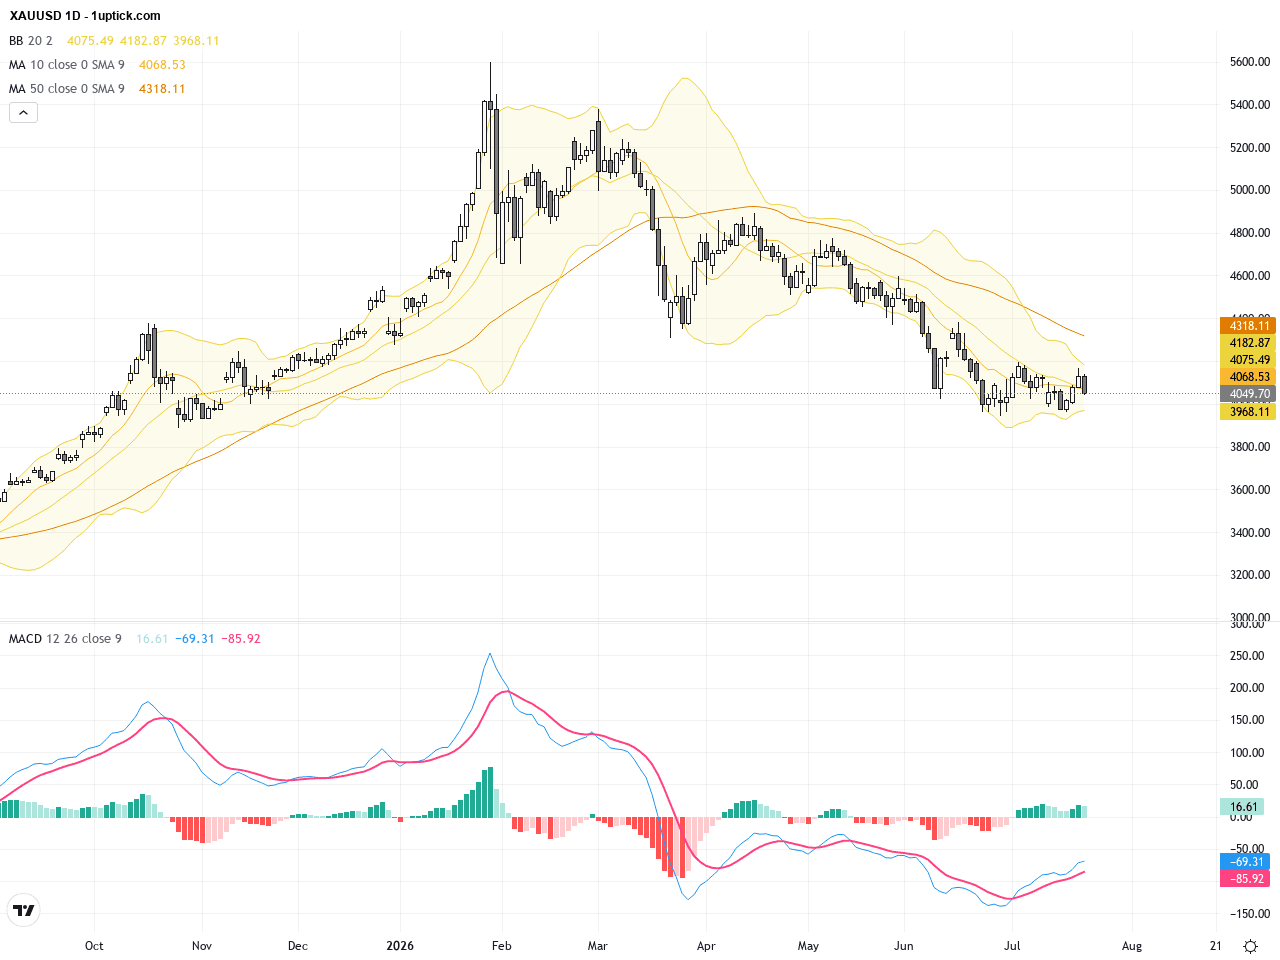
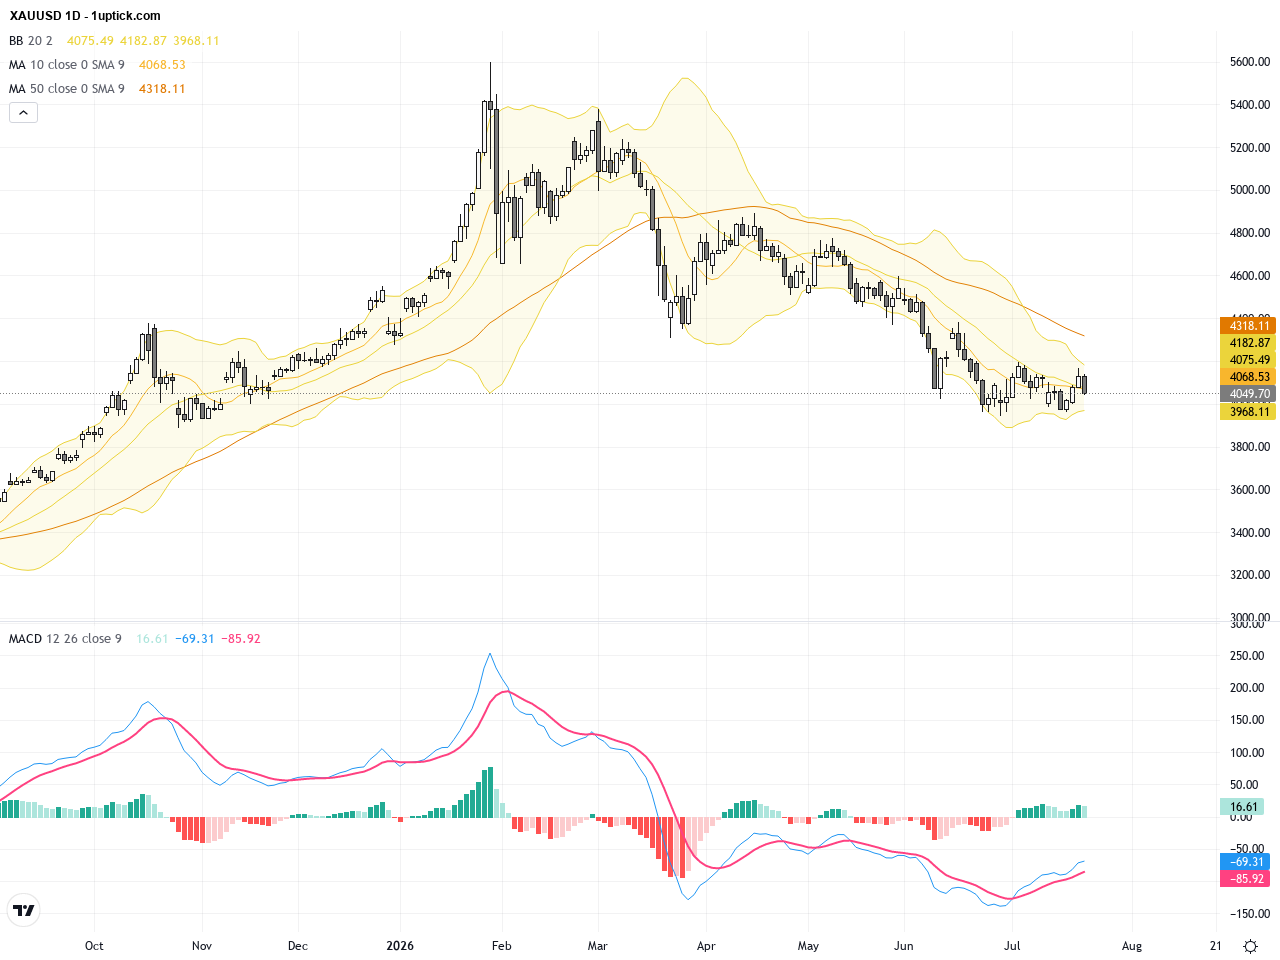
On the daily chart, XAUUSD has been retreating from the 4200 resistance, entering a corrective phase with solid support near 4027. The 200-day moving average slopes gently upwards, supporting the long-term uptrend. Bollinger Bands have widened with price dipping below the mid-band, approaching the lower band support. The MACD has toggled from bearish to tentative bullish signals but lacks strong confirmation. Overall, the daily picture suggests short-term correction within a broader upward structure. Traders should monitor key daily support and resistance levels closely.
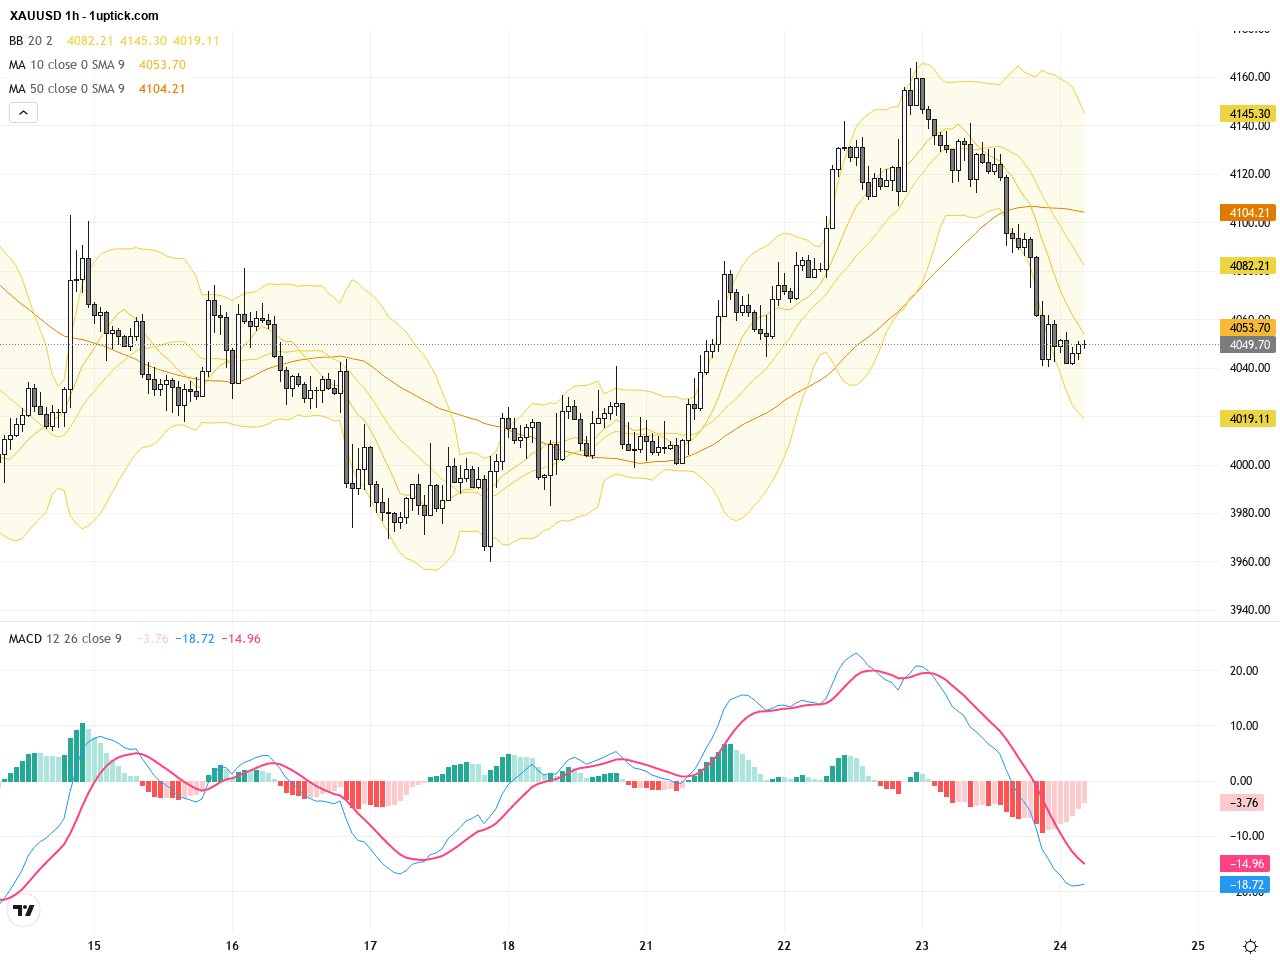
The hourly chart over the last 3-5 days shows XAUUSD forming a tightening range with higher lows and forming an ascending triangle pattern. Short-term moving averages intertwine, while Bollinger Bands narrow, signaling contraction before a potential breakout. MACD hovers around the zero line, indicating indecision but momentum divergence hints at a short-term bullish setup. A breakthrough above 4200 could trigger a fresh upward rally, while failure to clear resistance may prolong consolidation.
Technical Trend: Currently, XAUUSD shows a cautiously bullish trend with signs of short-term consolidation before a possible breakout.
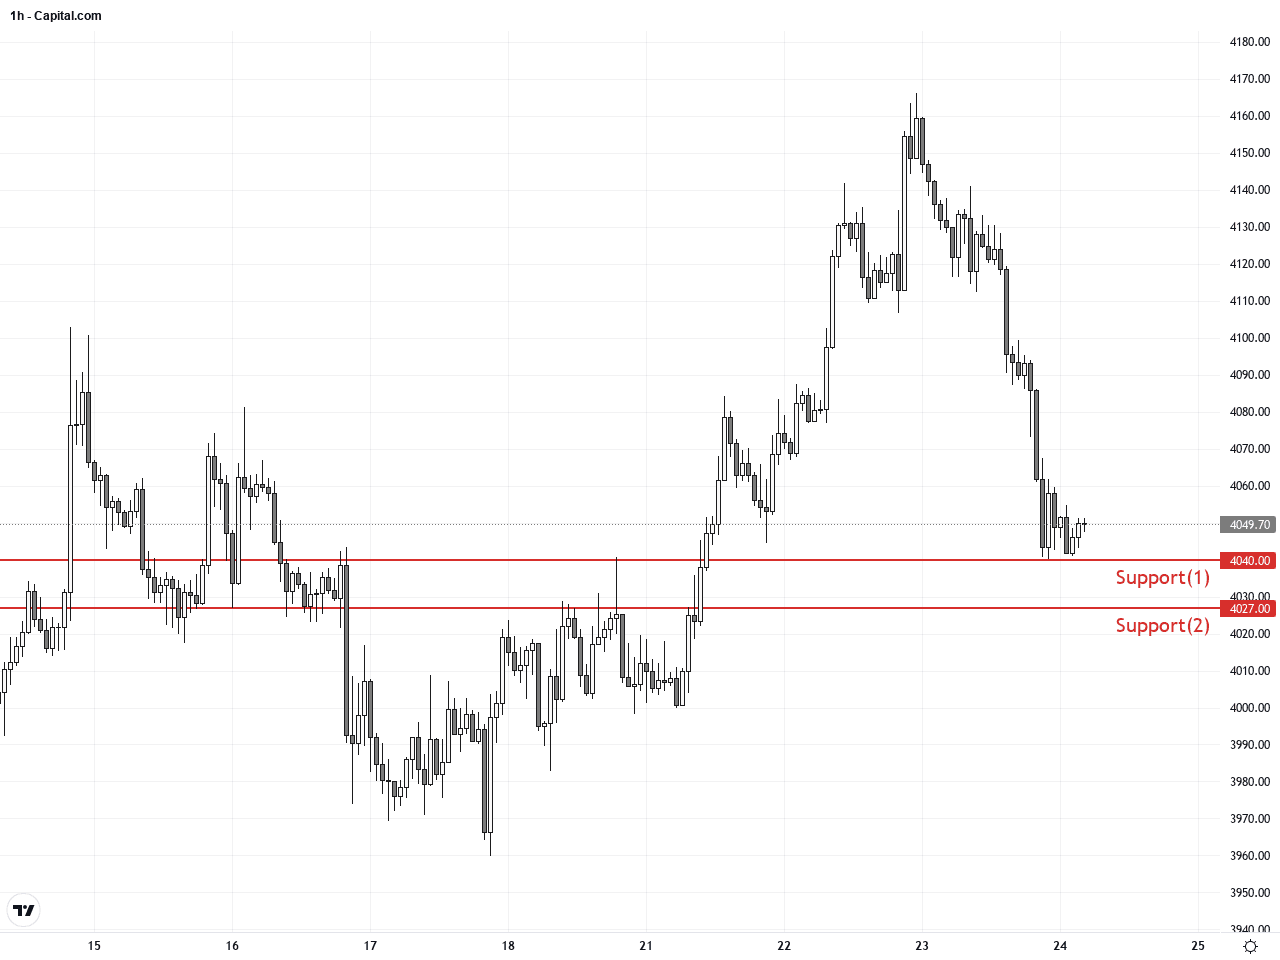
Technically, XAUUSD’s notable insight is the solid defense of the 4027 support on the daily, providing a springboard for short-term rebounds. The ascending triangle on the hourly chart, coupled with MACD divergence, marks a possible breakout scenario ahead. Recent candlestick patterns like hammer and engulfing indicate waning bearish momentum and buyers regrouping. Watching the 4200 resistance zone closely will be critical as a successful break could redefine the short-term trend upwards.Today’s economic calendar includes Australia’s employment change and US weekly jobless claims data. Australia’s stronger-than-expected job additions at 76.3k, with stable unemployment at 4.4%, support the AUD and may influence USD performance marginally. The US jobless claims report due at 14:30 GMT+1 is forecasted at 212k, slightly above last week’s 208k. Better-than-expected claims may bolster USD strength, pressuring gold prices. There are no direct high-impact events specifically affecting XAUUSD today; thus, market focus will remain on technical signals and geopolitical developments.
Resistance & Support
The above financial market data, quotes, charts, statistics, exchange rates, news, research, analysis, buy or sell ratings, financial education, and other information are for reference only. Before making any trades based on this information, you should consult independent professional advice to verify pricing data or obtain more detailed market information. 1uptick.com should not be regarded as soliciting any subscriber or visitor to execute any trade. You are solely responsible for all of your own trading decisions.