

 |
| Gold V.1.3.1 signal Telegram Channel (English) |
USDJPY: Yen Intervention Triggers Key Technical Reversal Signals Amid Market Uncertainty, August 5, 2026
2026-08-05 @ 11:01
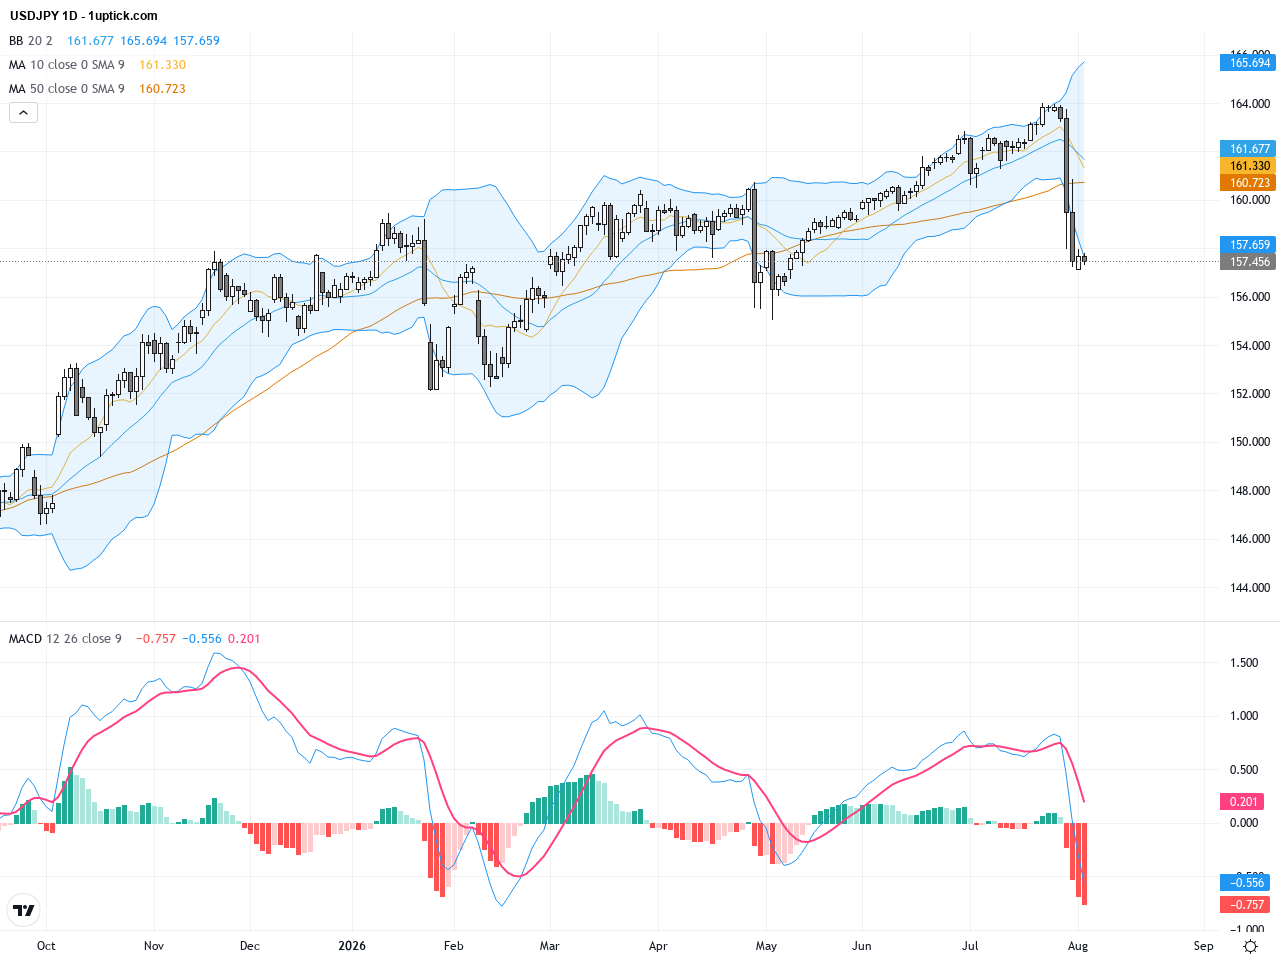
Over the past 24 to 48 hours, the USD/JPY pair has experienced notable volatility and pressure. Following a rare, coordinated intervention by Tokyo and the US last week supporting the yen, the currency slipped slightly on Tuesday but maintained most of its gains from that move. The closing price yesterday was 157.455, a modest decline from the previous day, reflecting cautious market sentiment post-intervention.
Latest market news points to multiple factors supporting the yen: upbeat wage data from Japan, hawkish minutes from the Bank of Japan signaling potential tightening, and a weaker US dollar pressured by strong stock markets and falling crude oil prices. These combined signals have limited USD/JPY’s upside recovery, as investors remain wary of further currency interventions by the Japanese authorities aiming to stabilize the yen.
For the average investor, this situation can be likened to a race where one contender briefly takes the lead but faces relentless pursuit from rivals. On one hand, the government intervention bolsters the yen, while on the other, the US dollar struggles amid economic headwinds. Going forward, markets will watch closely to see if the yen can break out of its current range or if intervention efforts will successfully prevent USD/JPY from rising above 164 in the coming weeks.
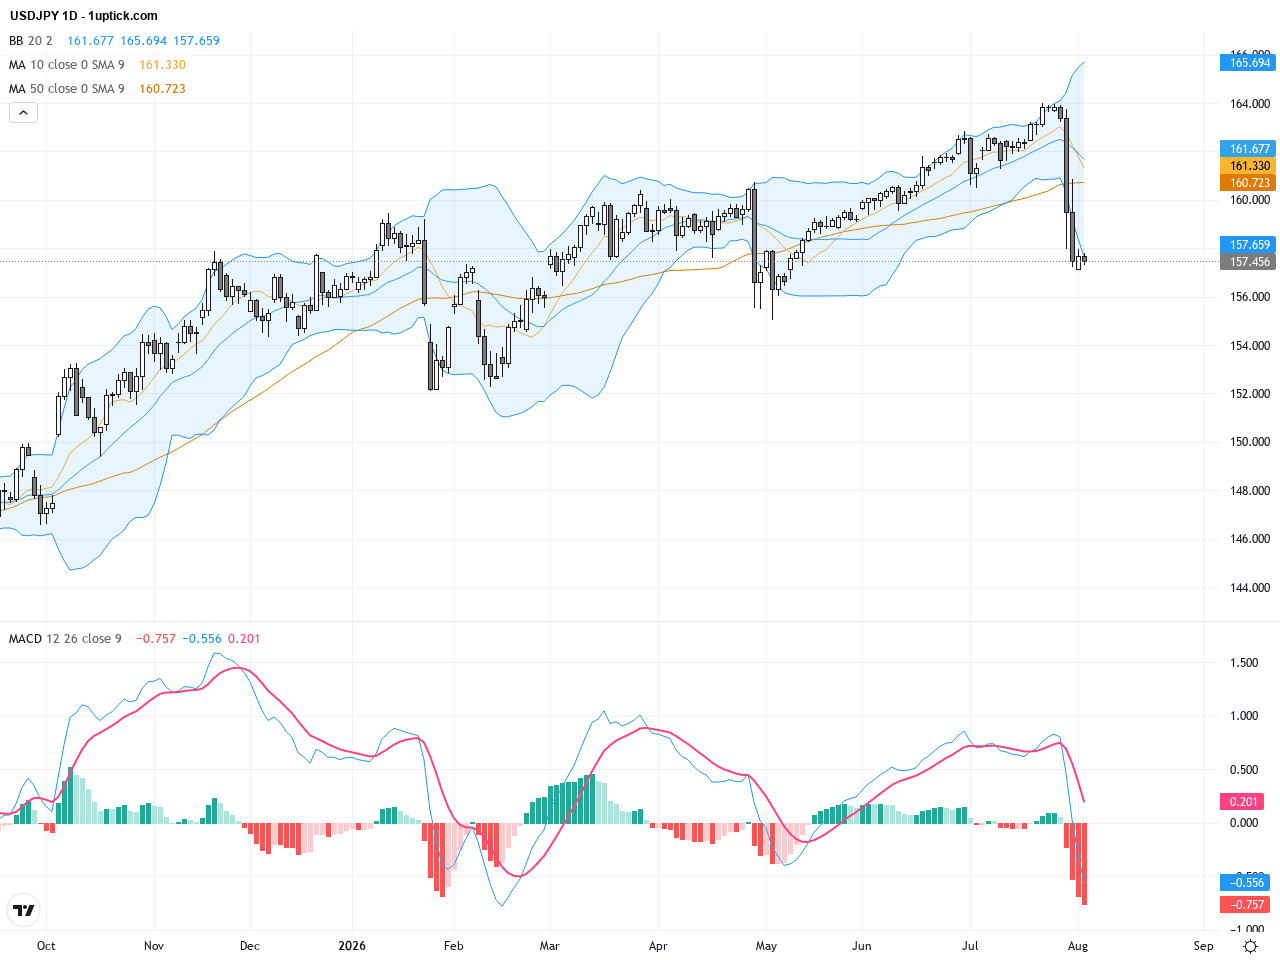
On the daily chart, USDJPY has been in a clear downtrend from the recent highs near 163, now consolidating around the 157 level. The 50-day moving average (around 161.35) and 200-day moving average (around 157.93) indicate short-term weakness, but price hovering just below the 200-day suggests possible short-term support. The Bollinger Bands show tightening volatility, implying contraction. The MACD remains negative but with shrinking histogram bars, hinting at slowing bearish momentum and potential for rebound. Overall, the daily view signals a short-term bearish bias, with market intervention news contributing to ongoing price uncertainty and the need to monitor moving average support closely.
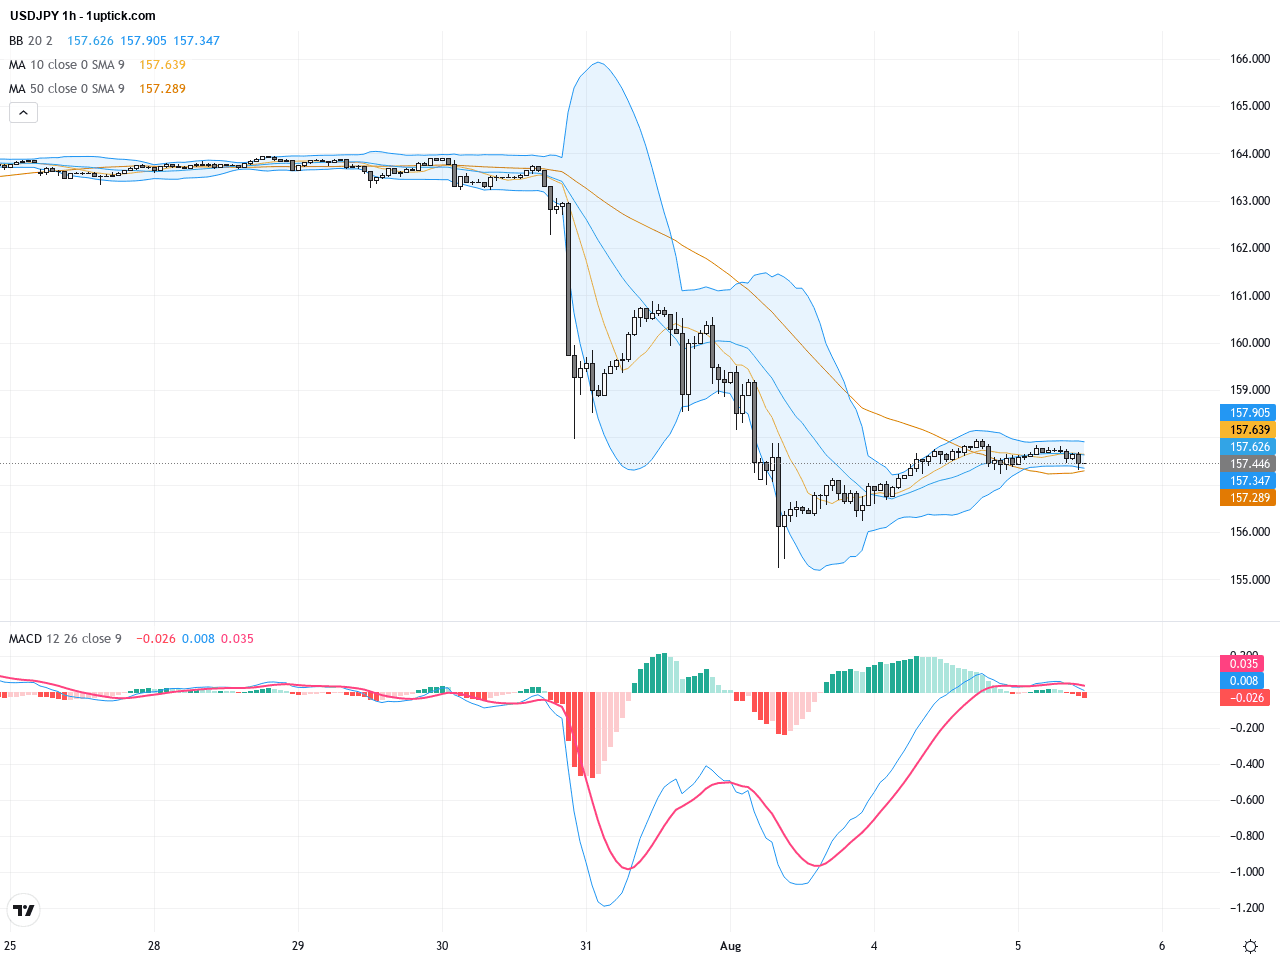
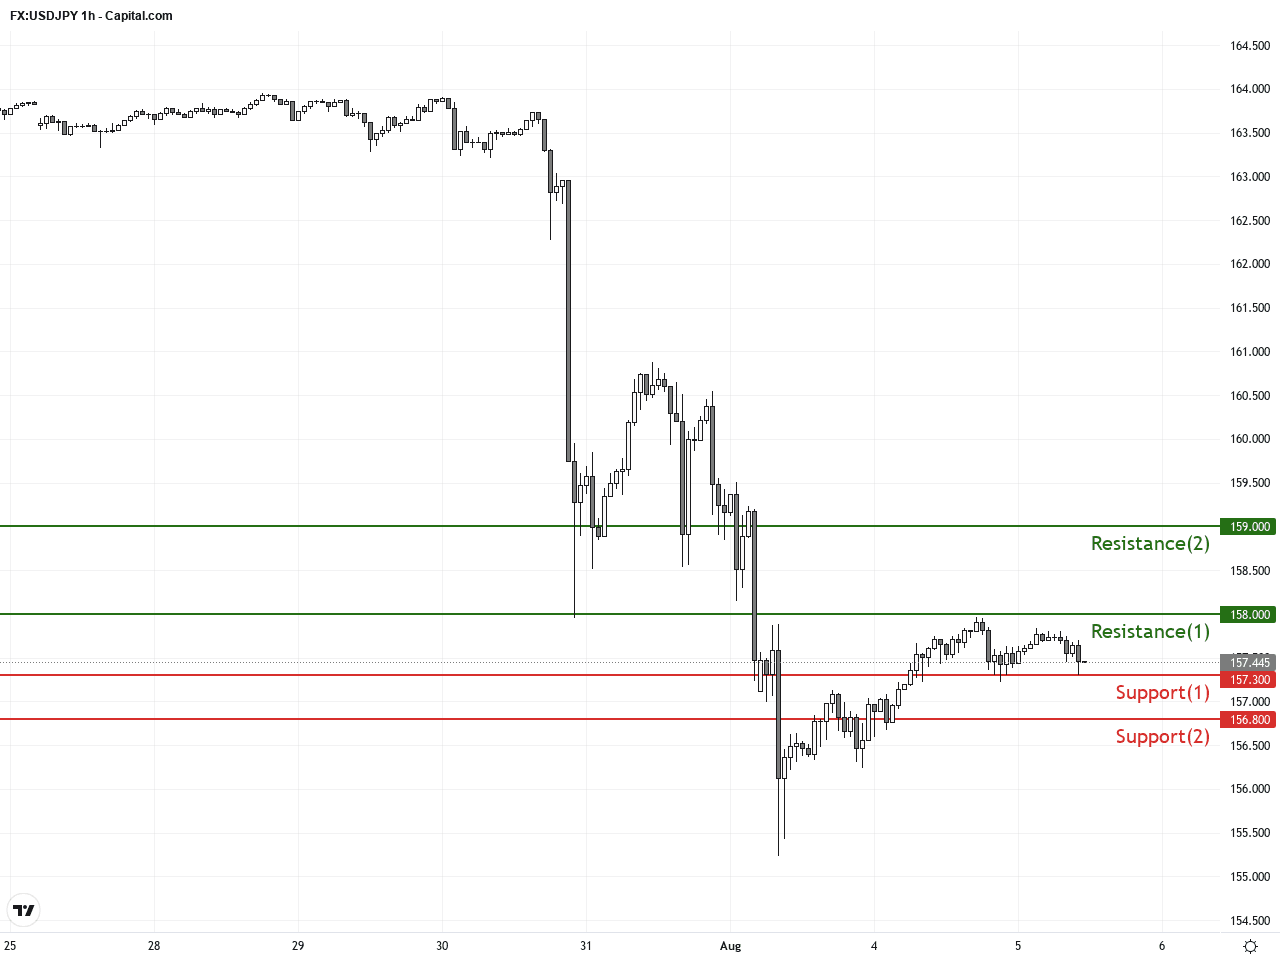
Analyzing the last 3-5 days on the hourly chart, USDJPY shows signs of a bottoming consolidation within a clear support-resistance band between 156.8 and 158. Short-term moving averages such as the 20 and 50 EMA intertwine, confirming a sideways range. Bollinger Bands are tight near the middle band, suggesting low volatility. MACD and signal lines reside below zero but indicate a possible bullish crossover forming. Recently, a bearish engulfing candlestick emerged, signaling short-term selling pressure. Traders should watch for potential breakout or breakdown from the established range to identify next directional moves.
Technical Trend: Volatile and Uncertain Consolidation Phase
Technically, USDJPY faces pressure from moving averages and Bollinger Bands tightening, favoring a bearish bias, but MACD momentum shows signs of slowing as histogram bars shrink and a small reversal pattern forms. The recent market intervention disrupted the natural trend, creating a cautious trading environment. A potential descending wedge pattern on the daily chart suggests a possible rebound if the critical 157 support holds. However, a bearish engulfing candlestick warns of possible near-term declines. Traders should carefully monitor price action around key support and resistance zones and upcoming economic releases to optimize entry and exit points.Today’s economic calendar in GMT+1 features the Bank of Japan June meeting minutes release at 01:50, a key event likely to influence USDJPY as investors seek policy hints amid ongoing intervention concerns. Additionally, US labor market data and ISM Non-Manufacturing Index scheduled in the afternoon (14:15 and 16:00) are highly relevant, potentially impacting the USD side of the USDJPY pair. No other major direct events affecting the yen are on today’s slate. Consequently, BoJ minutes and US employment data are the focal points for anticipating near-term volatility and directional bias in USDJPY.
Resistance & Support
The above financial market data, quotes, charts, statistics, exchange rates, news, research, analysis, buy or sell ratings, financial education, and other information are for reference only. Before making any trades based on this information, you should consult independent professional advice to verify pricing data or obtain more detailed market information. 1uptick.com should not be regarded as soliciting any subscriber or visitor to execute any trade. You are solely responsible for all of your own trading decisions.