

 |
| Gold V.1.3.1 signal Telegram Channel (English) |
USDCAD: Rising Amid Oil Weakness, Watch Key 1.4150 Resistance and Technical Patterns, August 6, 2026
2026-08-06 @ 13:01
Over the past 24 to 48 hours, the USD/CAD pair showed significant volatility, with yesterday’s closing price around 1.4014. The market was broadly influenced by fluctuations in oil prices and expectations of further Fed rate hikes, supporting the US dollar against the Canadian dollar. Early in the week, a strong domestic trade performance helped the Canadian dollar stabilize temporarily, but it was subsequently pressured by declining international oil prices, pushing USD/CAD above the 1.40 level again.
Recent market news highlights that Bank of America analysts forecast USD/CAD to fall to 1.38 by 2027. However, in the short term, with rising expectations of Fed hikes, the dollar is expected to climb toward 1.44 in September. Additionally, reports of a possible 60-day ceasefire agreement between the US and Iran briefly softened the dollar’s safe-haven demand, but overall, the weakening oil prices and persistent geopolitical risks in the Middle East continue to favor the greenback.
For the average investor, these fluctuations reflect how funding shifts with US policy direction and commodity price changes influencing demand for the Canadian dollar. The drop in oil prices directly undermines the loonie’s support, putting pressure on Canadian-dollar denominated assets. Meanwhile, the dollar’s safe-haven appeal amid geopolitical tensions and an unclear Fed outlook attracts buying interest, creating the current volatile trading environment in USD/CAD.
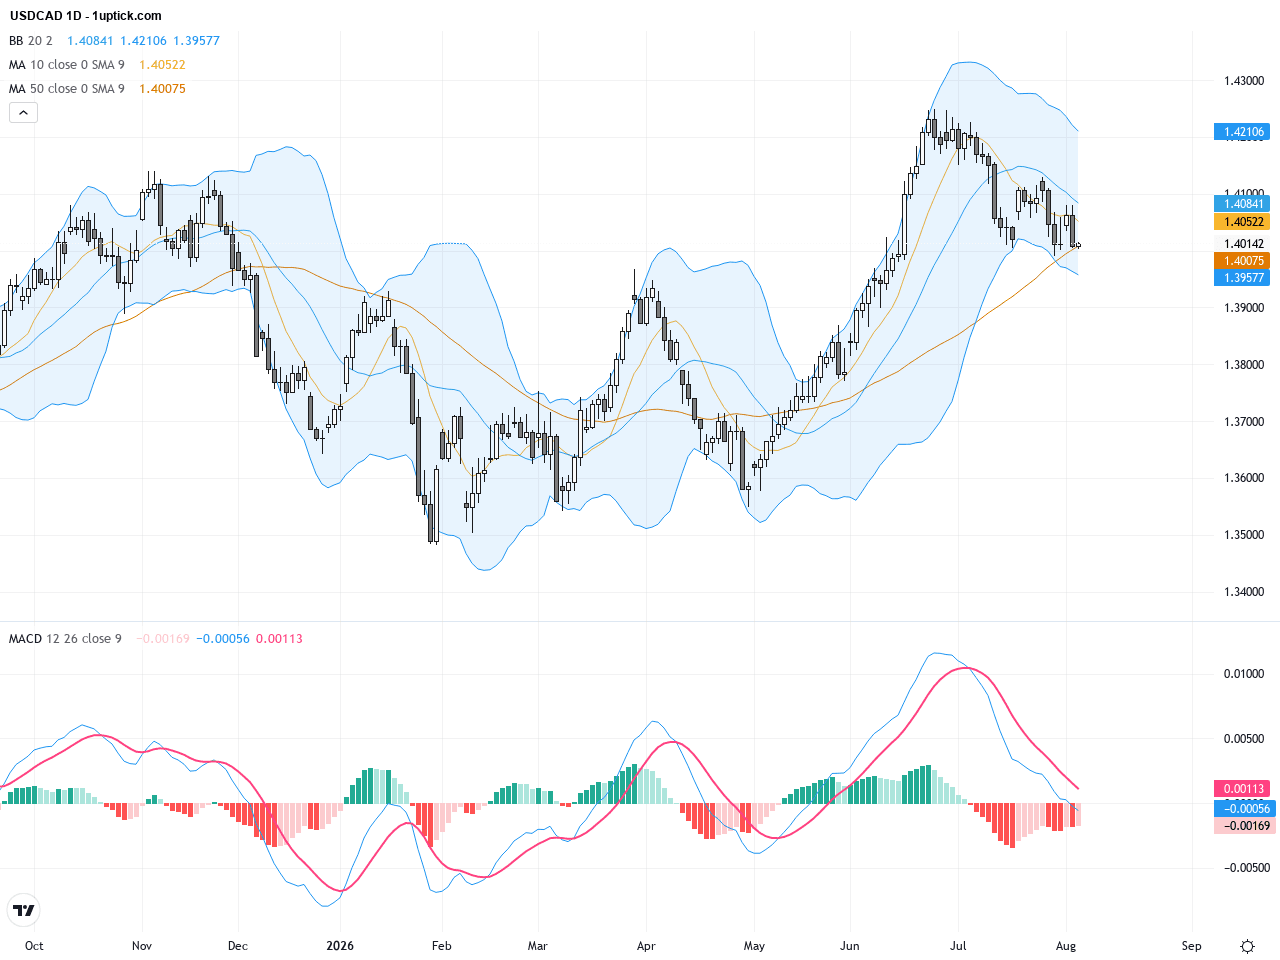
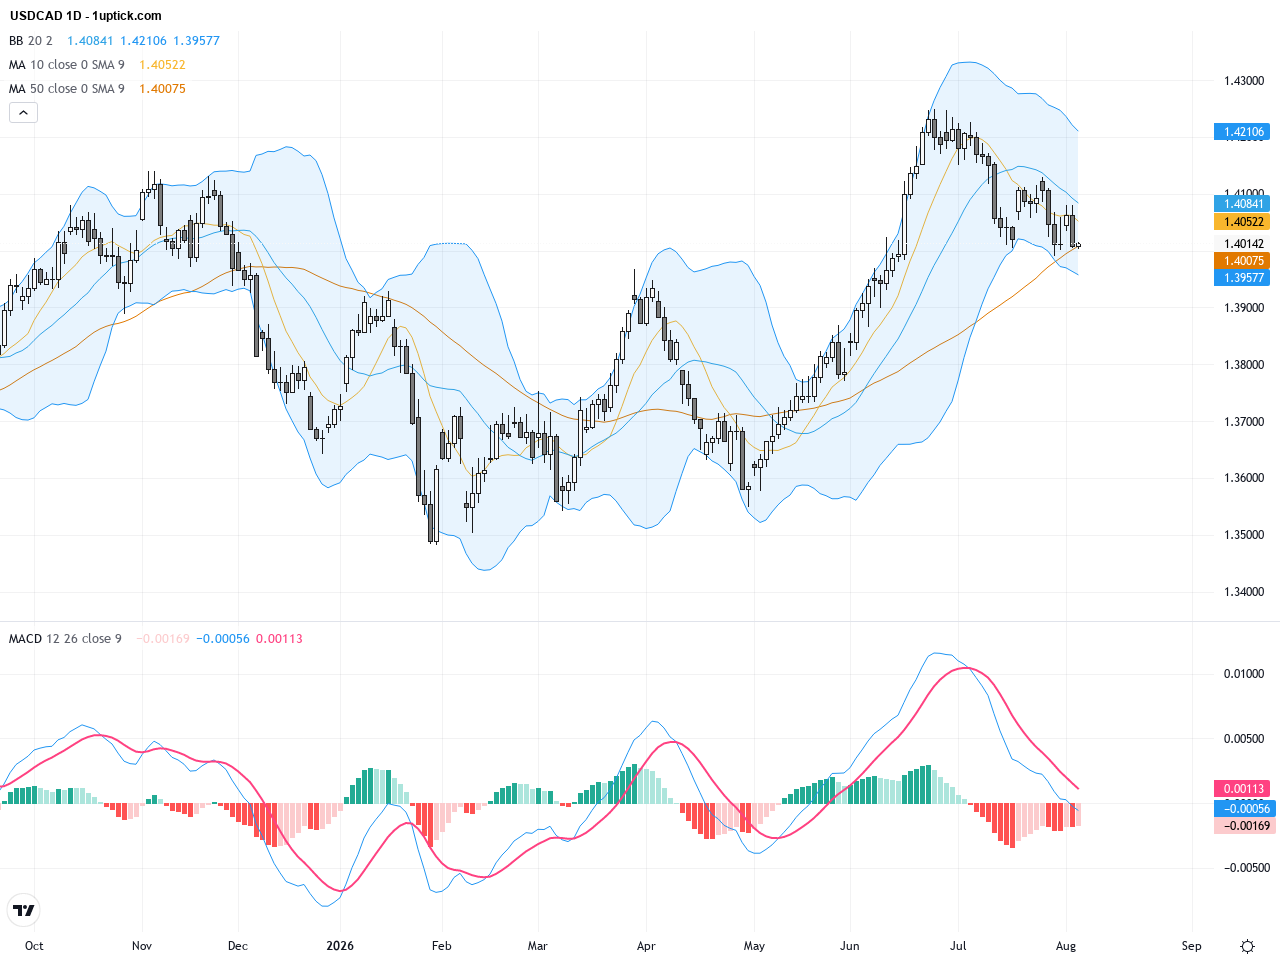
On the daily chart, USDCAD exhibits a gradual uptrend, rising from around 1.38 at the end of July to above 1.40 currently. Price has broken above the 50-day moving average (around 1.41) but remains close to the 200-day moving average (roughly 1.38) level. The Bollinger Bands are slightly expanding, indicating increasing volatility. The MACD shows a bullish momentum with a golden cross and enlarging histogram bars, suggesting that the medium to long-term uptrend still has strength.
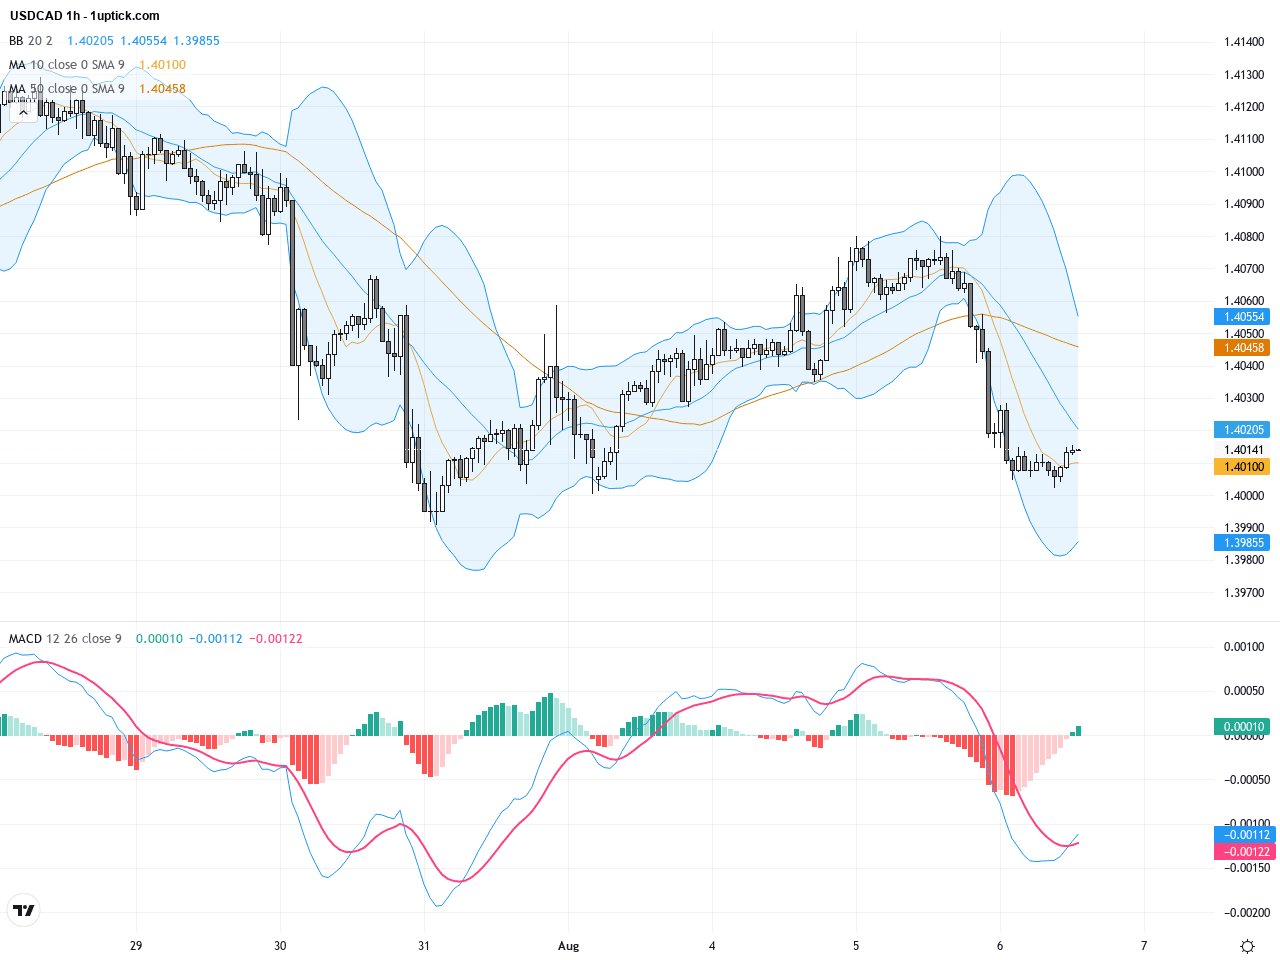
Examining the hourly chart over the past five days, prices have been consolidating between 1.398 and 1.408, with short-term moving averages intertwined and Bollinger Bands narrowing, signaling a period of indecision. The MACD edges upward but low volume keeps short-term breakout confirmation uncertain. A recent bullish engulfing candlestick pattern suggests a potential for bullish attempts within the next 24 hours.
Technical Trend: Consolidation with bullish bias
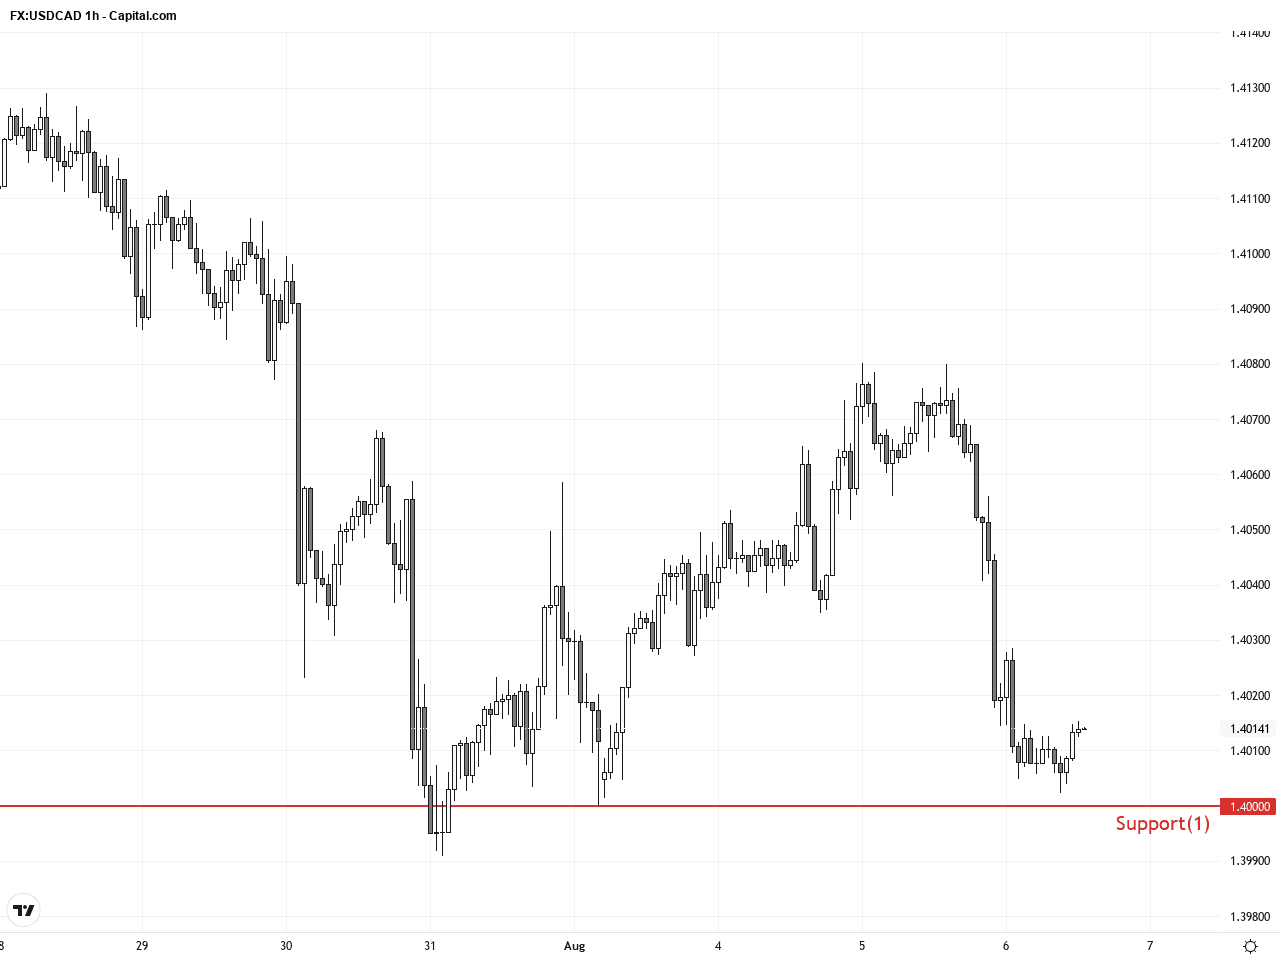
Technically, bulls dominate on the daily timeframe as MACD’s golden cross and widening Bollinger Bands support an upward trend, with price near key resistance at 1.4150. The hourly chart’s consolidation and recent bullish engulfing candle imply a probable short-term breakout. Traders should watch volume to confirm breakouts and consider oil price trends and Fed policy as pivotal fundamental drivers for USDCAD.Today’s economic calendar (GMT+1) does not feature any major Canadian or US data that directly impacts USDCAD. However, investors should watch the US 14:30 (GMT+1) releases of Non-Farm Productivity and Unit Labor Costs for Q2. Better-than-expected figures could support the USD broadly, potentially pushing USDCAD higher, while weaker data might lead to pullbacks.
Resistance & Support
The above financial market data, quotes, charts, statistics, exchange rates, news, research, analysis, buy or sell ratings, financial education, and other information are for reference only. Before making any trades based on this information, you should consult independent professional advice to verify pricing data or obtain more detailed market information. 1uptick.com should not be regarded as soliciting any subscriber or visitor to execute any trade. You are solely responsible for all of your own trading decisions.