

 |
| Gold V.1.3.1 signal Telegram Channel (English) |
AUDUSD: Breakout Above 0.7100 Signals Strong Bullish Momentum and Positive Trading Outlook, August 24, 2026
2026-08-24 @ 06:01
Over the past 48 hours, the AUD/USD pair has demonstrated notable volatility, climbing steadily from yesterday’s close at 0.71129 to around 0.71668, reflecting a near 0.76% gain. This robust performance is primarily driven by multiple soft US macroeconomic data releases, including lower-than-expected inflation and retail sales figures, which have weakened the US Dollar and reduced safe-haven demand.
Market headlines such as “AUD/USD breaks above 0.7100 for the first time since June” and “AUD/USD recovers after weak jobs report” have had a direct impact on investor sentiment. Despite weak Australian employment data, the swift recovery in the Australian Dollar suggests expectations that the Reserve Bank of Australia may pause or adjust its monetary policy approach. Combined with US economic softness, these factors have propelled the AUD/USD exchange rate upward.
For the average investor, this means the market currently favors the Australian Dollar amid doubts about the US economic growth outlook, with capital inflows clearly directed toward AUD assets. Monitoring upcoming US economic indicators remains crucial, as they continue to be the primary driver of AUD/USD price movements.
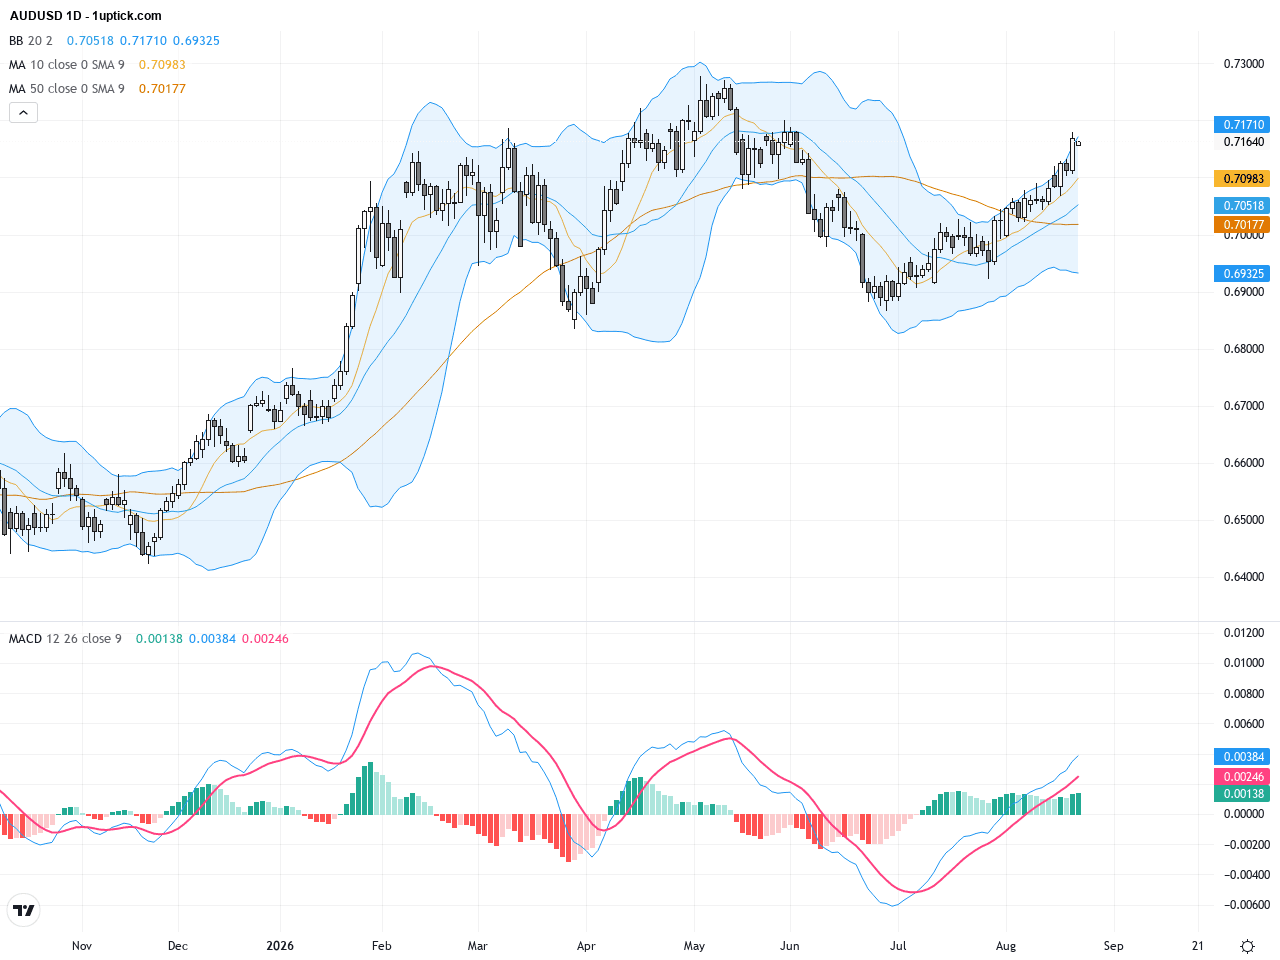
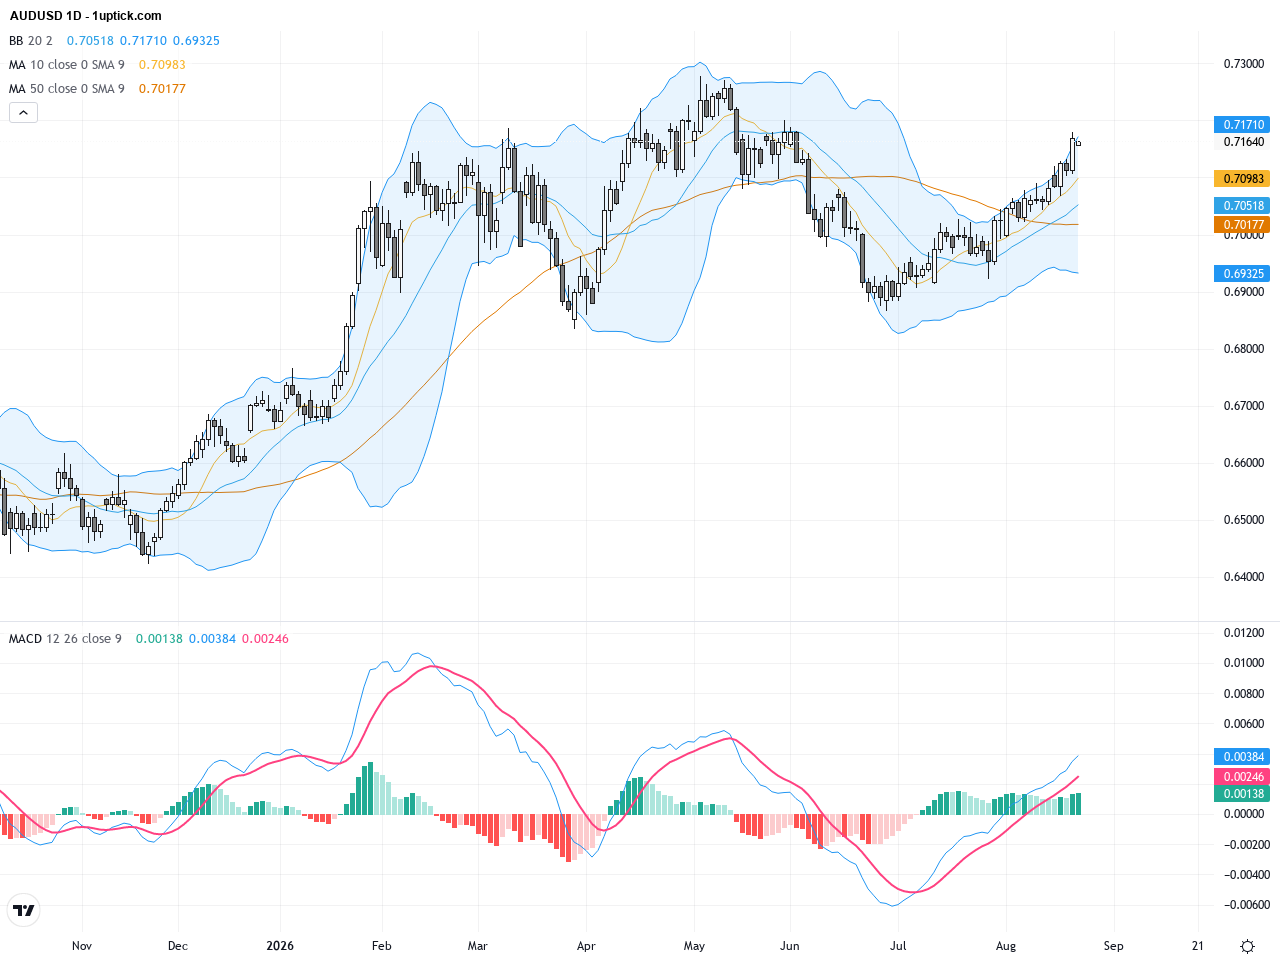
The daily chart shows AUDUSD recovering steadily from the 0.6920 support area and breaking above both the 50-day and 200-day moving averages, at approximately 0.6997 and 0.6940 respectively. This marks a clear shift to a bullish mid-to-long term trend. The Bollinger Bands are widening, signaling increased volatility. The MACD indicates a bullish crossover with accelerating momentum. Overall, the daily setup supports further price gains above key moving averages.

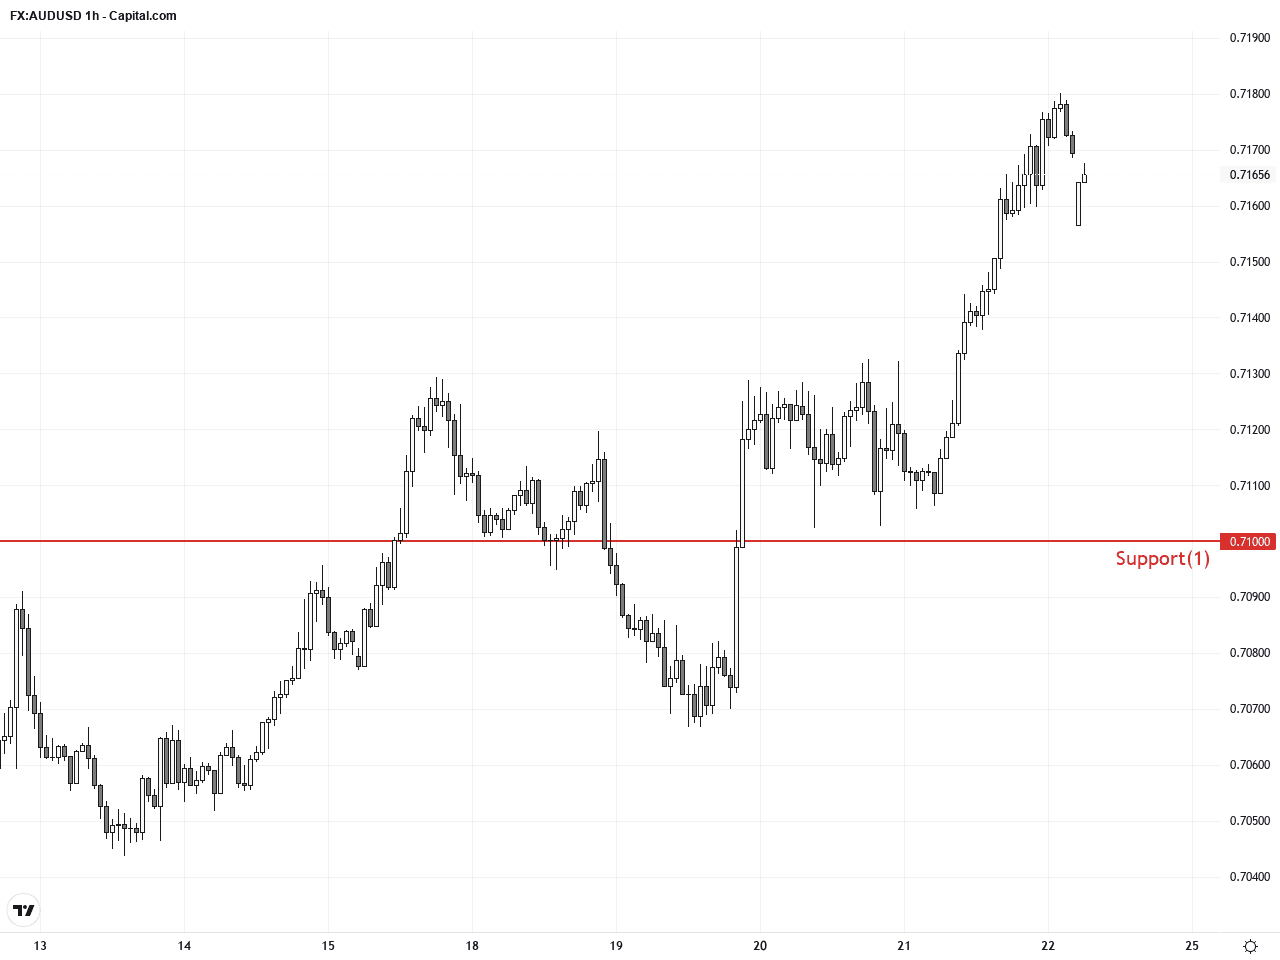
On the hourly chart, the pair has steadily climbed over the past 3 to 5 days, successfully testing and breaking through the psychological 0.7100 level multiple times. The Bollinger Bands narrowed then expanded, indicating growing bullish momentum. Short-term moving averages are aligned bullishly, and the MACD histogram shows increasing momentum with a recent bullish engulfing candlestick pattern signaling sustained upward pressure in the next 24 hours.
Technical Trend: Currently, the trend is decisively bullish, with price comfortably above key moving averages and momentum indicators signaling further upward movement.
Key technical insights center on the daily chart breakout above the 50 and 200-day moving averages, confirming a bullish mid-term trend. The hourly chart’s bullish engulfing candle and MACD bullish crossover indicate strong short-term upward momentum. Maintaining support above 0.7100 is critical. A break above the year high at 0.7277 could unlock further upside potential for AUDUSD.Today’s economic calendar in GMT+1 time includes New Zealand retail sales data expected at 0.1% quarter-over-quarter growth and several retail sales and money supply indicators from Poland. None of these releases are expected to have a significant direct impact on AUDUSD. Traders should therefore focus on global risk sentiment and upcoming US data for more decisive catalysts.
Resistance & Support
The above financial market data, quotes, charts, statistics, exchange rates, news, research, analysis, buy or sell ratings, financial education, and other information are for reference only. Before making any trades based on this information, you should consult independent professional advice to verify pricing data or obtain more detailed market information. 1uptick.com should not be regarded as soliciting any subscriber or visitor to execute any trade. You are solely responsible for all of your own trading decisions.