

 |
| Gold V.1.3.1 signal Telegram Channel (English) |
WTI Crude Oil: Price Adjustment Amid Strait of Hormuz Talks and Technical Trend Analysis, August 27, 2026
2026-08-27 @ 06:03
Over the past 24 to 48 hours, WTI crude oil prices have experienced a clear decline. On August 26, 2026, WTI crude closed at $82.23, slightly down from the previous day. The main driver behind this price movement was news about the potential reopening of the Strait of Hormuz, which sparked market optimism about a supply recovery, thus putting downward pressure on oil prices.
Specifically, talks between Iran and Oman regarding the establishment of a temporary shipping corridor through the Strait of Hormuz have led the market to believe that previous supply constraints caused by geopolitical tensions could ease. This led to WTI crude prices falling for three consecutive days, as investors feared a decline in risk premiums and a reduction in supply pressures. Meanwhile, other energy-related indices, such as Canada’s S&P/TSX, faced cautious sentiment due to weakness in base metals and information technology sectors.
For average investors, this development is like seeing a glimmer of peace on the horizon. If supply bottlenecks ease, oil prices face downside risk—especially after recent price surges driven by geopolitical fears. Market participants should closely monitor developments in Middle East diplomacy and negotiations, as supply-side uncertainty remains a key factor driving oil price volatility.
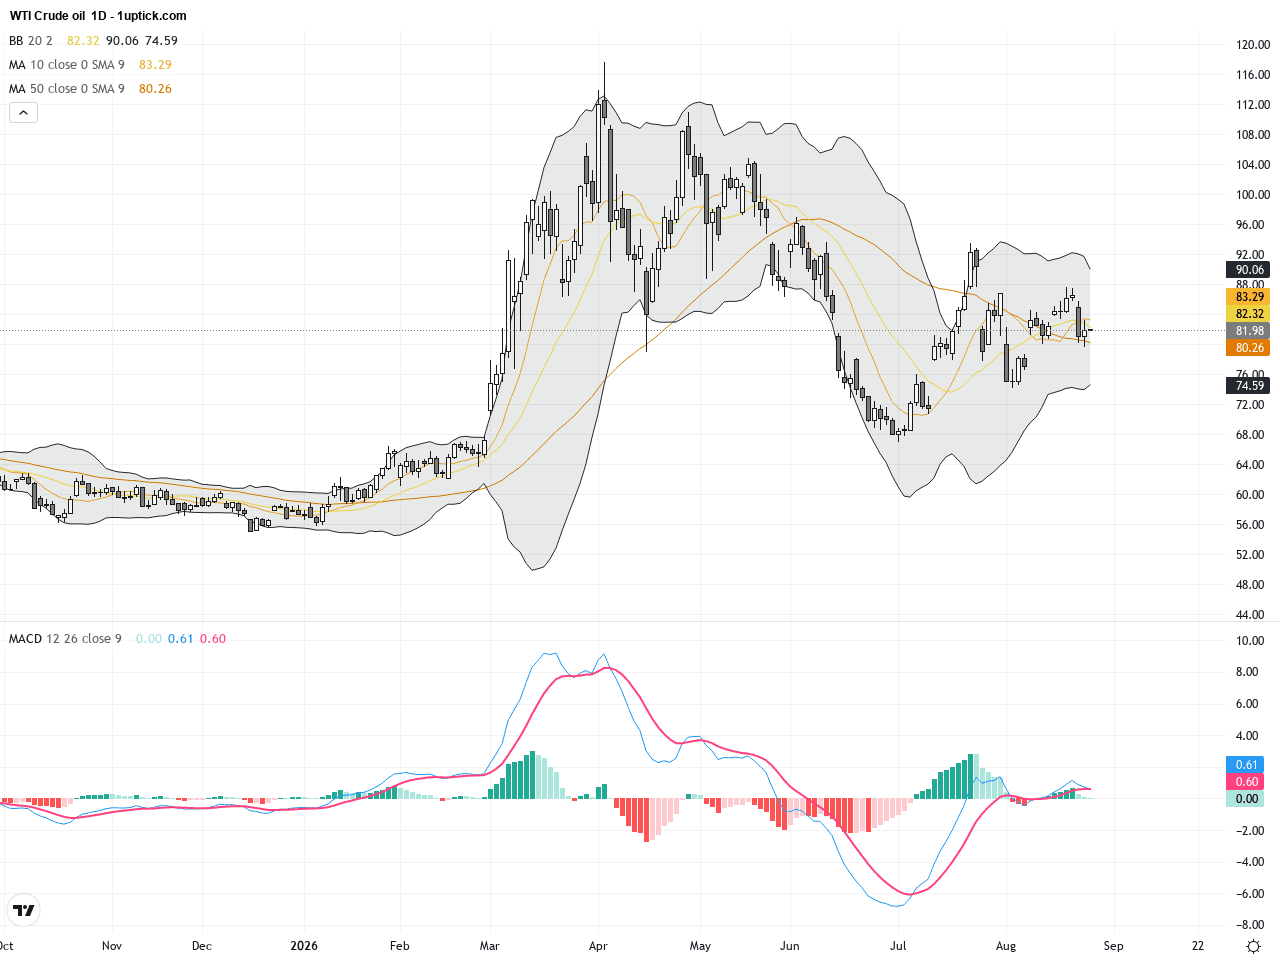
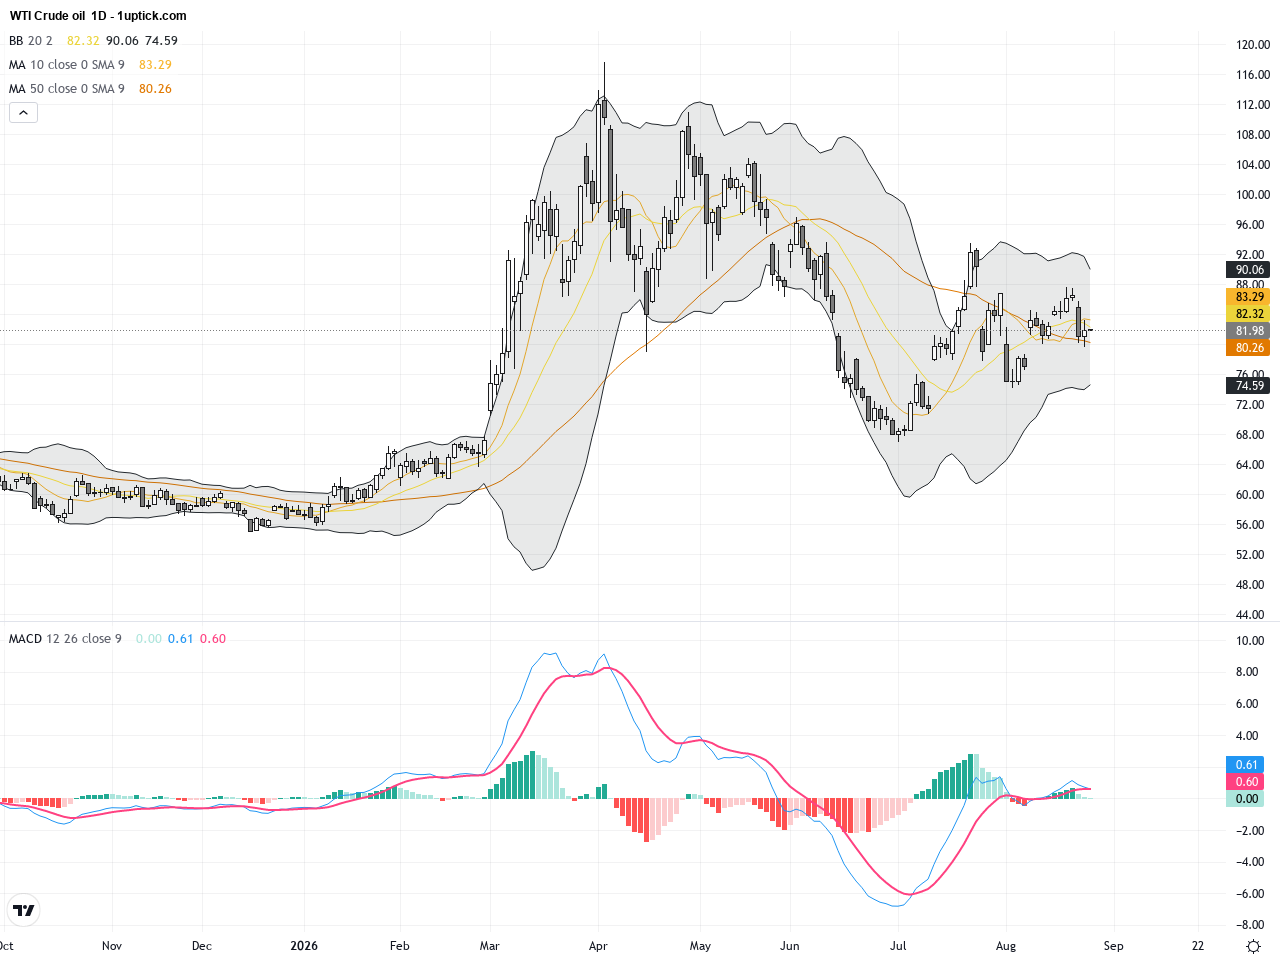
The daily chart of WTI Crude Oil shows a clear adjustment trend from mid to late August, with prices contracting from recent peaks. The Bollinger Bands are tightening, and prices recently tested the lower band multiple times, indicating short-term downward pressure. The MACD is flattening from positive territory, reflecting weakening bullish momentum. The moving averages are interwoven, suggesting an unclear trend and a consolidative phase.
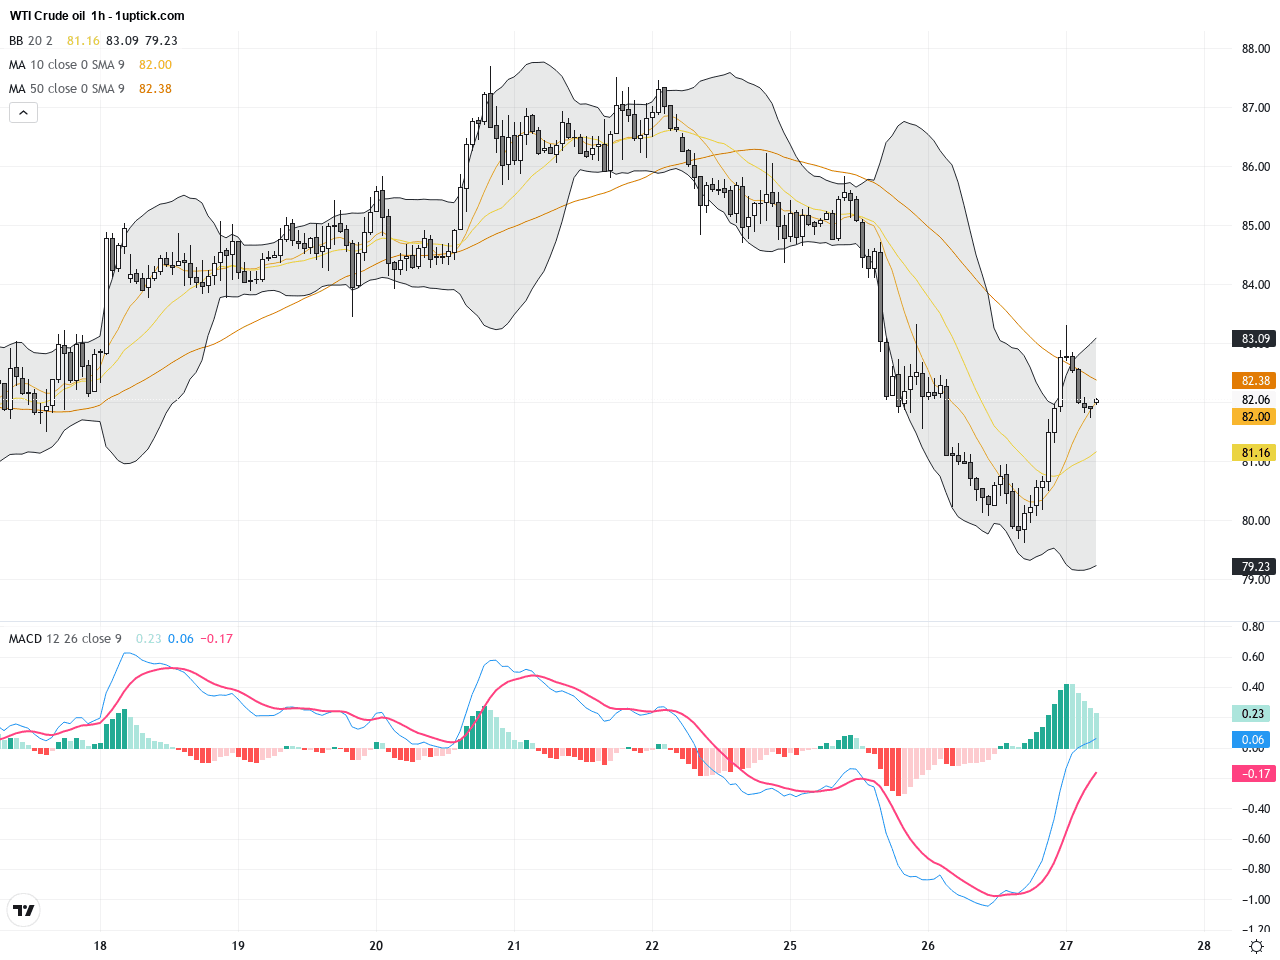
On the hourly chart over the past 3 to 5 days, WTI displays a downtrend with repeated tests of support near $79.60. A minor MACD bearish crossover has appeared, and prices remain below the 20-period moving average, indicating significant short-term selling pressure. The formation resembles a descending flag pattern, signaling likely continued consolidation before a breakout.
Technical Trend: WTI Crude Oil is currently in a ‘cautiously bearish’ consolidation and retracement phase, with the market trending lower in the short term while awaiting clearer direction.
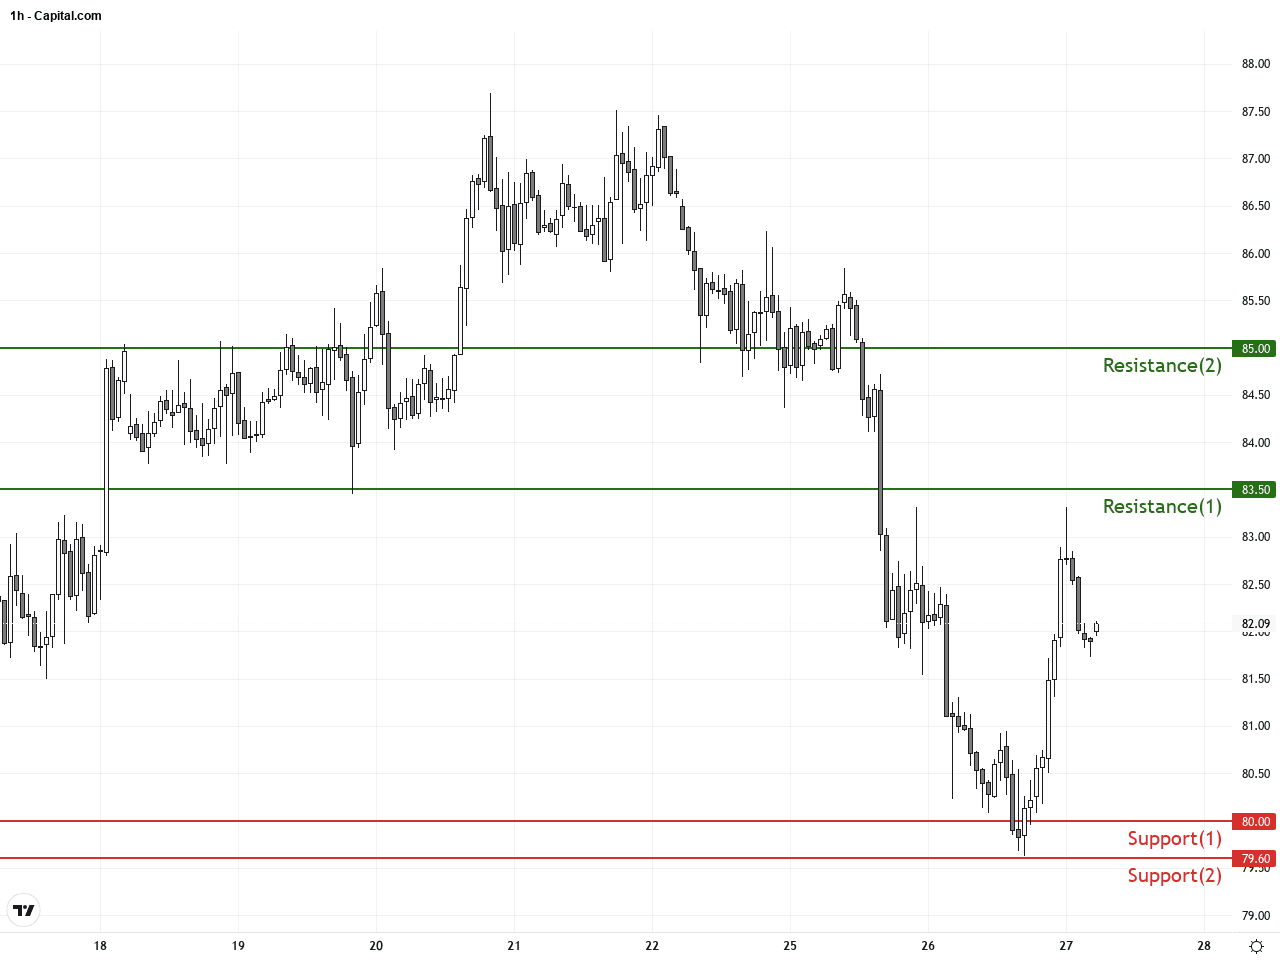
WTI’s technical setup signals increasing short-term pressure with a three-day losing streak. Talks about the Strait of Hormuz have introduced supply optimism, weighing on prices. The MACD bearish cross and Bollinger Band dynamics support a short-term correction outlook. No strong reversal signs appear yet on the daily chart; watch how the $80 support holds to gauge next moves. A break below could trigger further downside.There are no significant economic events scheduled today that directly impact WTI Crude Oil. Market participants should remain focused on geopolitical developments as key drivers for price movements.
Resistance & Support
Run Live WTI Crude Oil Analysis
The above financial market data, quotes, charts, statistics, exchange rates, news, research, analysis, buy or sell ratings, financial education, and other information are for reference only. Before making any trades based on this information, you should consult independent professional advice to verify pricing data or obtain more detailed market information. 1uptick.com should not be regarded as soliciting any subscriber or visitor to execute any trade. You are solely responsible for all of your own trading decisions.