

 |
| Gold V.1.3.1 signal Telegram Channel (English) |
XAUUSD Breaks Above 200-Day MA: Gold Eyes $4,750 Resistance with Strong Bullish Momentum, August 27, 2026
2026-08-27 @ 05:04
Over the past 48 hours, gold (XAUUSD) has remained robust, continuing its recent upward momentum. Starting from the closing price of $4593.35 on August 26, gold briefly surged above the $4750 level, hitting a fresh near-term high that underscores growing investor demand for safe havens amid market uncertainty. This rally is linked to the expansion of the U.S. Treasury’s bond buyback plan addressing the debt ceiling issue, which has driven down long-term yields and supported the gold price, pushing it into overbought territory.
Recent market news highlights how America’s debt challenges have rewritten the rules of engagement in financial markets, fueling concerns over monetary policy and economic outlook. This has increased gold’s allure as a hedge, with price targets being raised as high as $5600. Meanwhile, strong Personal Consumption Expenditures (PCE) data have heightened expectations for further Fed rate hikes, briefly strengthening the USD and applying some pressure on gold, but not enough to derail its upward trend.
For the average investor, this means that despite fluctuations in economic stimuli and monetary policy, gold continues to shine as a reliable defensive asset. Recent developments suggest that investing in gold remains a smart strategy to guard against inflation and market turbulence, with a sustained bullish outlook in the medium to long term.
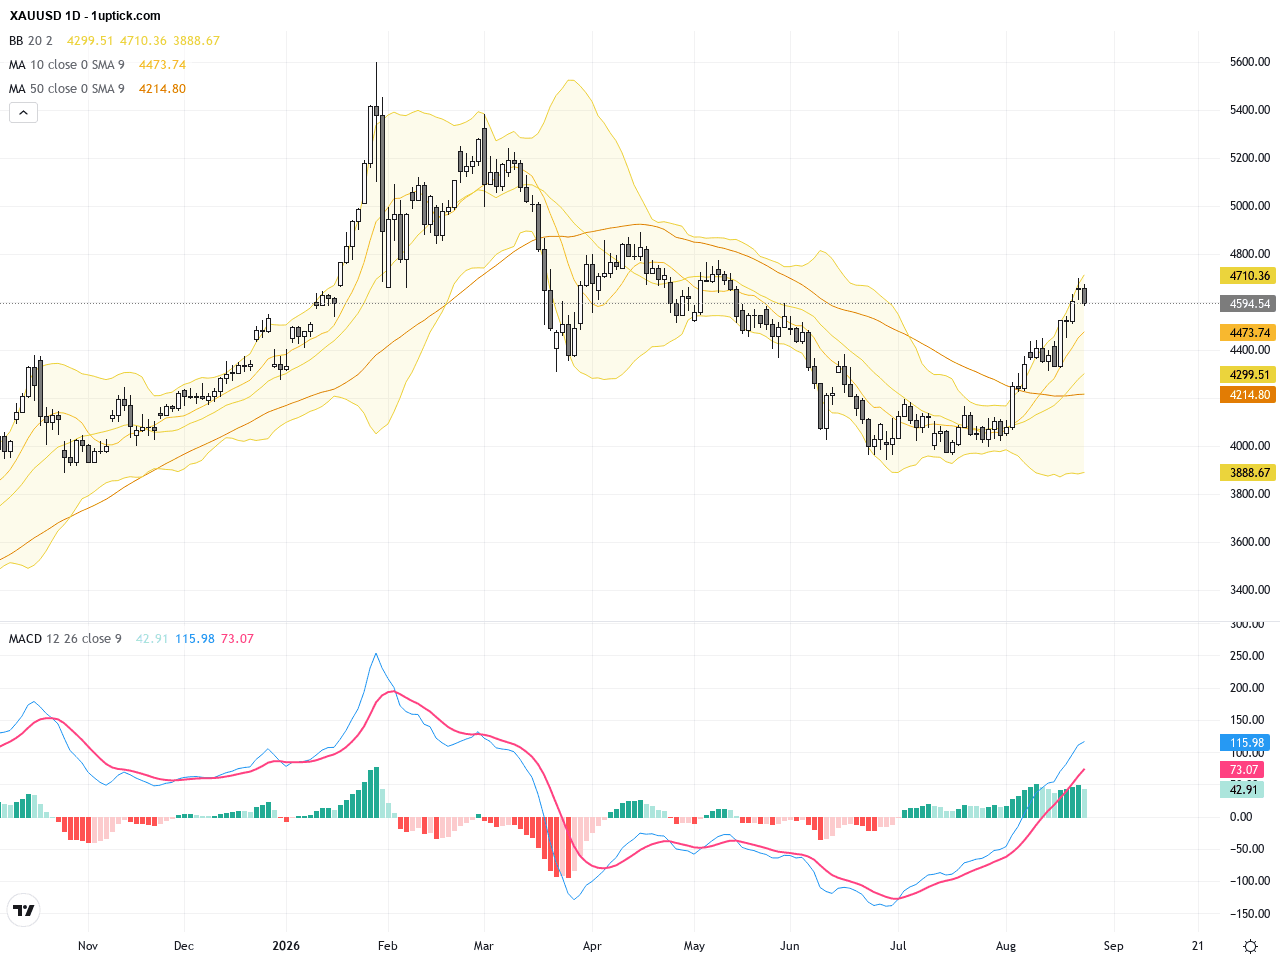
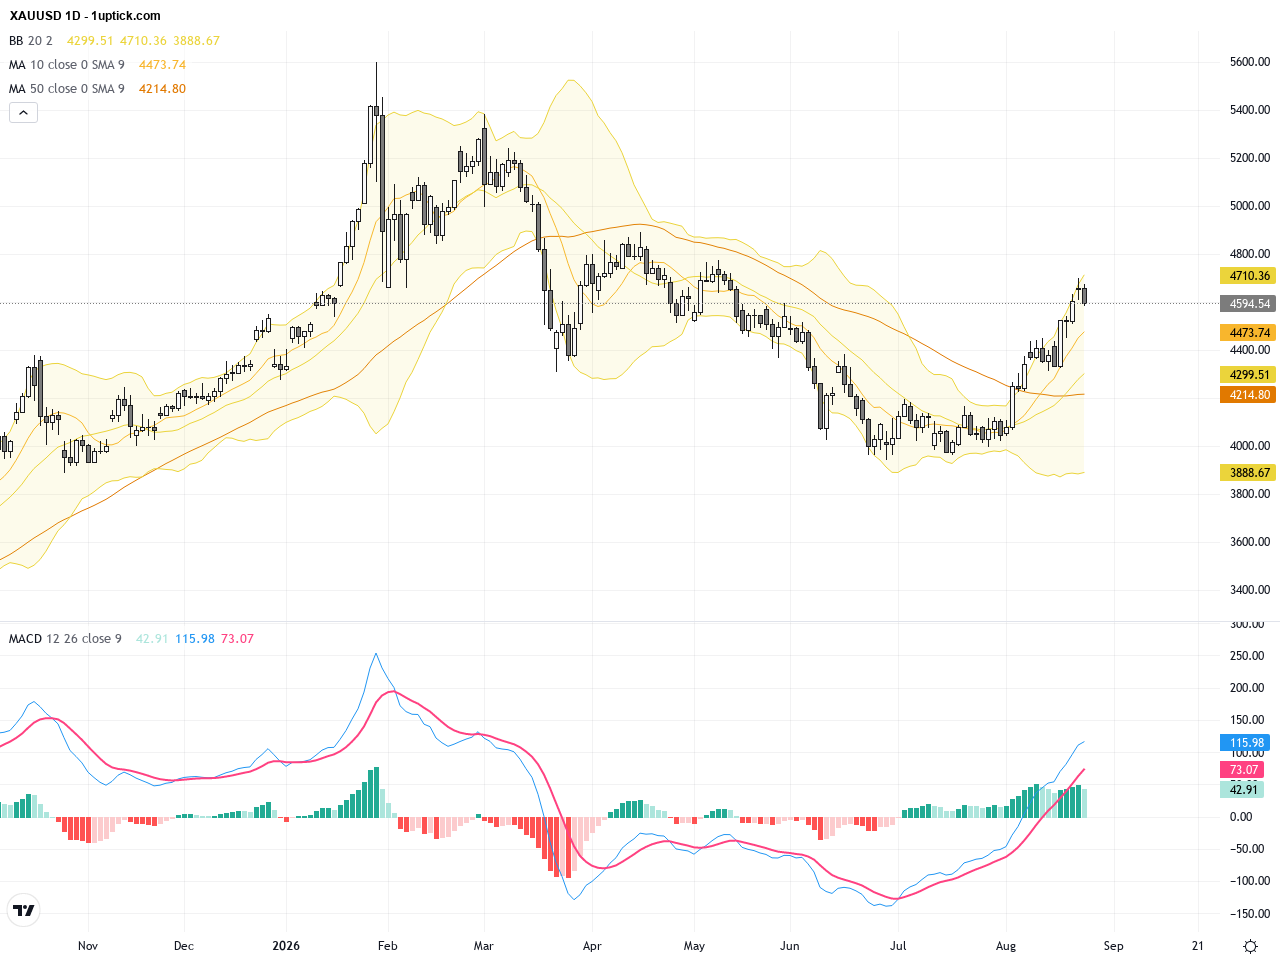
The daily chart shows a clear uptrend for XAUUSD, with the price recently breaking above the 200-day moving average—a strong bullish confirmation. Bollinger Bands reveal the price nearing the upper band, suggesting potential short-term overbought conditions. The MACD stays above zero and continues to widen, indicating strong momentum. Short-term moving averages remain above long-term averages, reinforcing the positive trend. Overall, the daily technical setup supports a bullish outlook with further upside potential toward key resistance levels.

The hourly chart over the past 3-5 days reflects intensified consolidation between $4,600 and $4,750. The 50-period MA crossed above and below the 200-period MA multiple times, illustrating tug-of-war between buyers and sellers. MACD shows frequent bullish and bearish crossovers, matching the sideways movement profile. The latest candlestick forms a bearish engulfing pattern, signaling a possible retracement within the next 24 hours. Traders should stay cautious and wait for a decisive breakout before committing to directional trades.
Technical Trend: Cautiously Bullish
Technically, XAUUSD has established a solid bullish structure after breaking and holding above the 200-day MA. However, the near-upper Bollinger Band and the recent hourly bearish engulfing candle suggest possible short-term correction. MACD remains in bullish territory on the daily, but hourly chart signals heightened volatility. Traders should watch for key resistance breaks and US economic data for high-probability setups.Today’s GMT+1 economic calendar highlights key US data releases at 14:30 (HKT 21:30), including July’s Personal Consumption Expenditures (PCE) and Core PCE. These data points are crucial in shaping USD strength and will indirectly influence XAUUSD. Should the readings surpass expectations, the USD may strengthen, applying downward pressure on gold. Conversely, softer results could boost gold prices. Market participants should monitor data releases closely to gauge short-term gold price moves.
Resistance & Support

The above financial market data, quotes, charts, statistics, exchange rates, news, research, analysis, buy or sell ratings, financial education, and other information are for reference only. Before making any trades based on this information, you should consult independent professional advice to verify pricing data or obtain more detailed market information. 1uptick.com should not be regarded as soliciting any subscriber or visitor to execute any trade. You are solely responsible for all of your own trading decisions.