

 |
| Gold V.1.3.1 signal Telegram Channel (English) |
AUDUSD Holds Near June Highs with Key Resistance at 0.7200: Trading Outlook & Technical Patterns, August 28, 2026
2026-08-28 @ 06:01
Over the past 48 hours, the Australian Dollar against the US Dollar (AUD/USD) has held near its June highs, maintaining levels above 0.7150 and closing yesterday at 0.71945. The market showed some volatility but overall remained consolidative, reflecting investor caution amid multiple prevailing factors.
The key drivers behind this movement included a surprise announcement from the US Treasury, which weakened the US dollar and in turn supported the Australian dollar. Additionally, market attention focused on the upcoming Australian Consumer Price Index (CPI) report, with traders eager to gauge inflation trends and anticipate the Reserve Bank of Australia’s monetary policy decisions.
Geopolitical tensions also played a significant role, especially with expected US sanctions on Iran, yet the Aussie held firm despite this uncertainty. Meanwhile, crude oil prices stubbornly staying above $100 a barrel bolstered demand for the resource-linked Australian currency.
For the average investor, this recent price action can be likened to waiting for a pivotal game to start: the US dollar’s weakness acting like a key player sidelined, allowing the AUD to take advantage, while inflation data and geopolitical risks represent the unpredictable factors making the market environment dynamic and requiring vigilant attention to upcoming data releases and global developments.
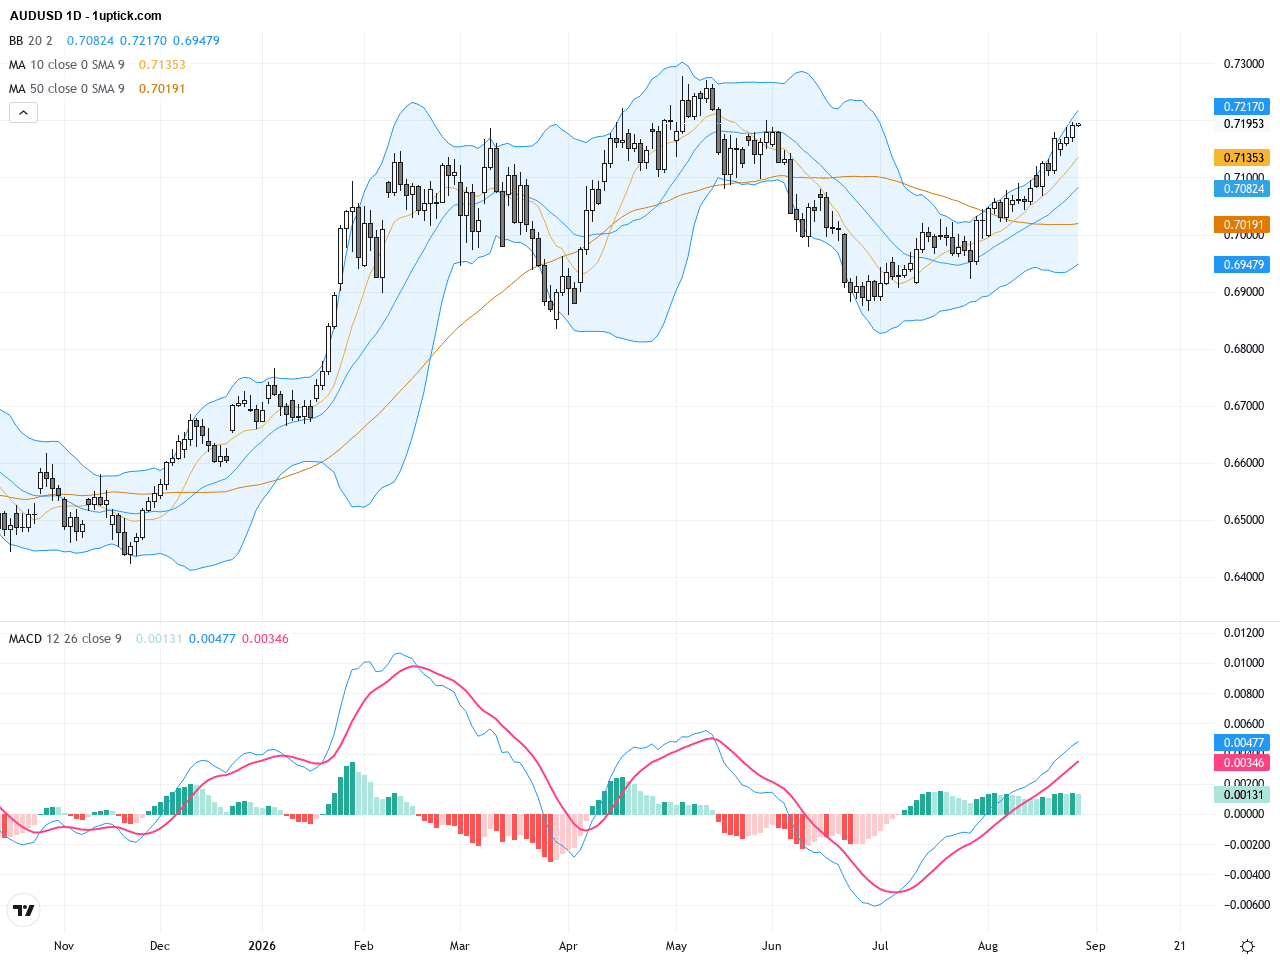
The daily chart shows AUDUSD in a steady uptrend since mid-year, currently approaching its near three-month peak around 0.7200. The price action repeatedly tests the 21-day EMA as support. Bollinger Bands appear to be narrowing, suggesting reduced volatility but no clear breakout yet. The MACD remains in positive territory, with an expanding histogram supporting the continuation of the bullish trend. Overall, the longer-term trend remains firmly bullish with steady buying interest on dips.
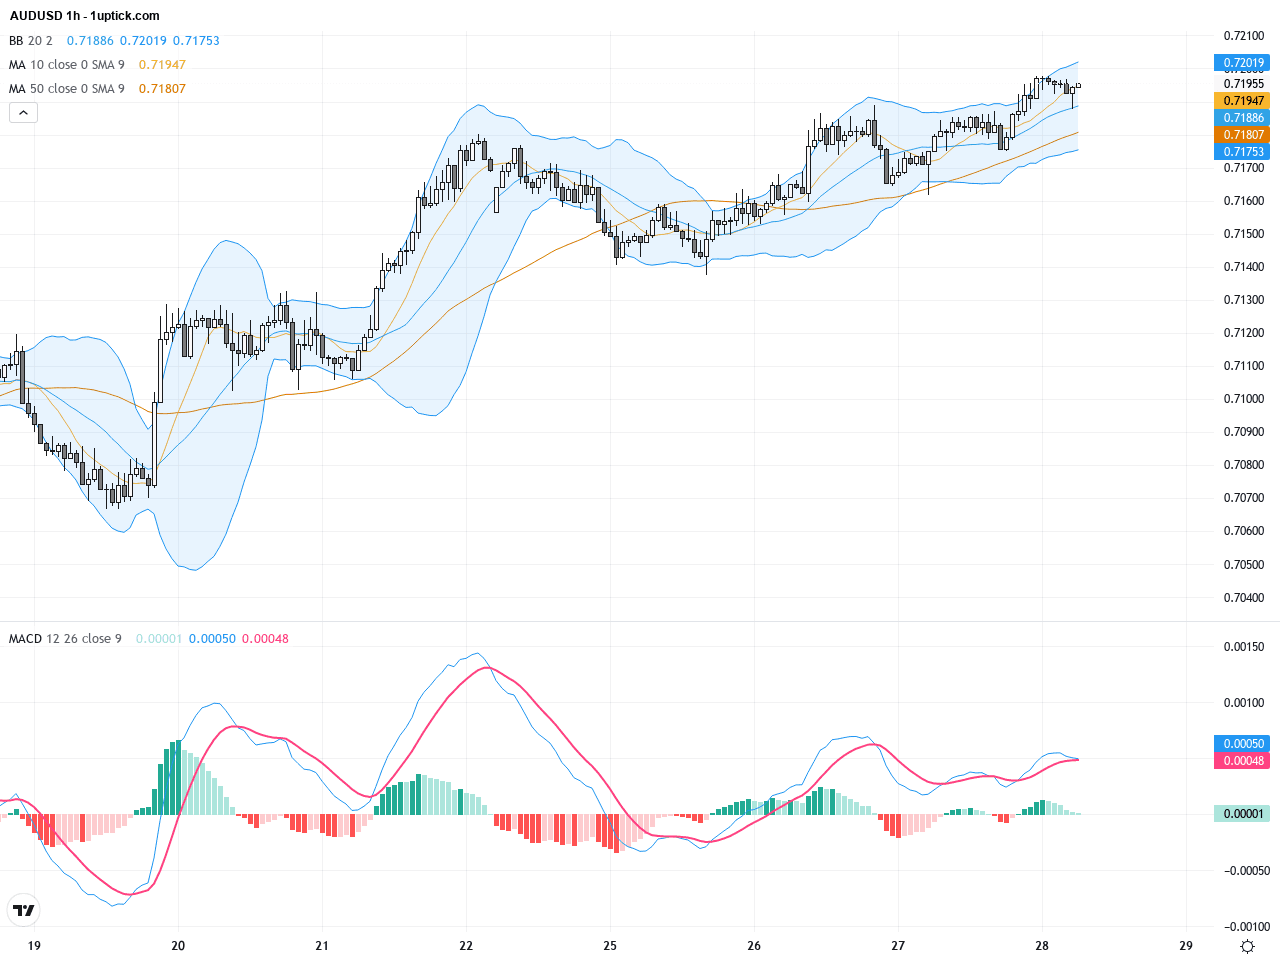
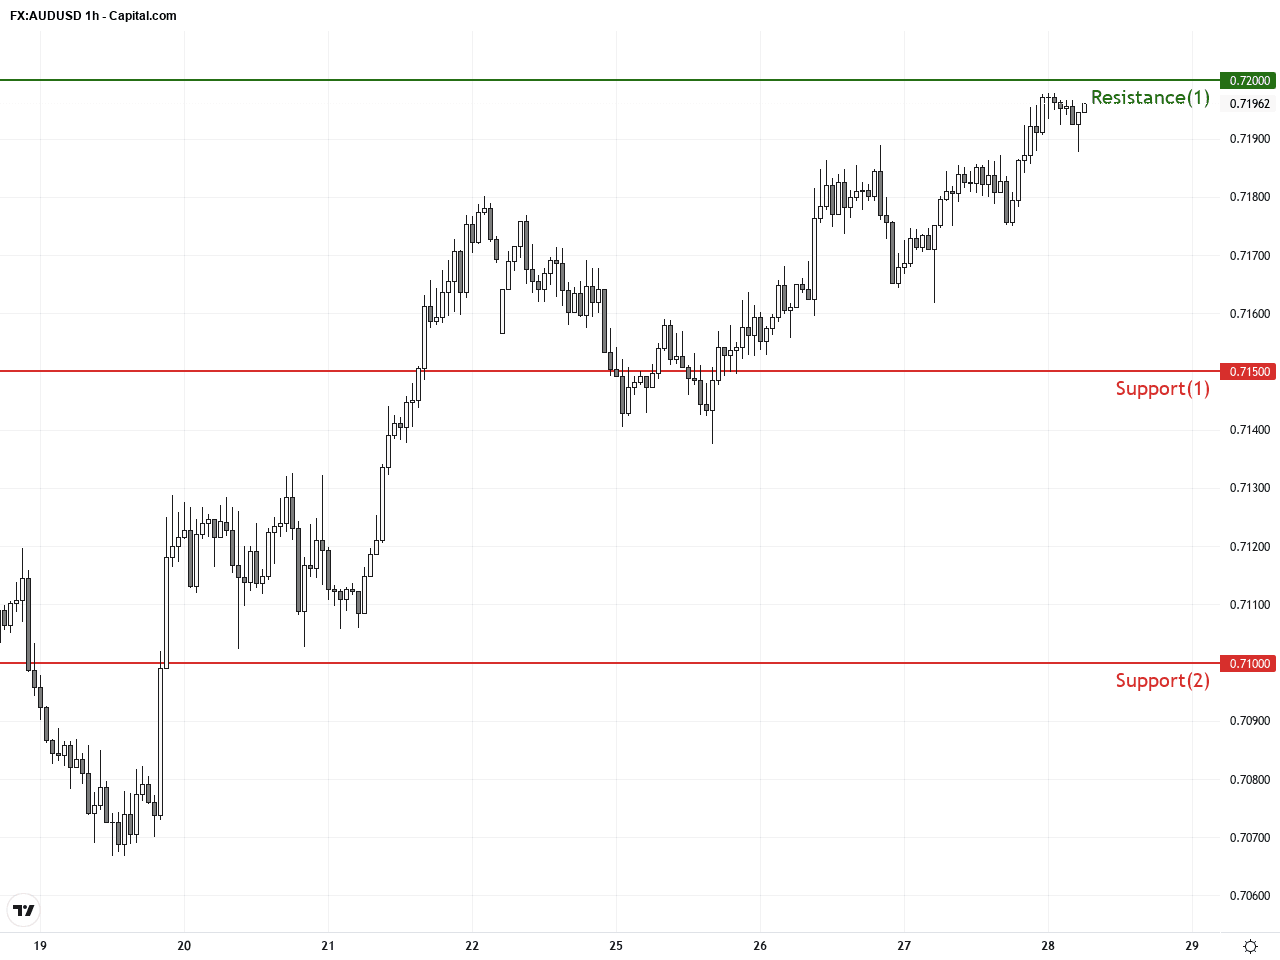
The hourly chart over the past five days reveals AUDUSD’s rebound from the 0.6920 support zone, breaking above key short-term moving averages and the 21 EMA. The MACD forms a bullish crossover above the zero line, while RSI sits near 70 but is not yet overbought. A flag consolidation pattern has formed recently, indicating a potential breakout. A successful breach of the 0.7200 resistance could pave the way for further gains in the near term.
Technical Trend: Cautiously Bullish
Technical analysis highlights AUDUSD at a pivotal juncture. The daily MACD histogram expansion and narrowing Bollinger Bands point to an impending trend continuation. The hourly flag pattern and bullish MACD crossover suggest near-term bullish momentum may accelerate in the next 24 hours. Key levels at 0.7150 support and 0.7200 resistance form the battleground for price action, making them critical to watch for breakout or pullback confirmation.Today’s economic calendar does not feature any major data directly impacting AUDUSD. However, market attention remains on the US Jackson Hole symposium, which could indirectly influence the USD and consequently the AUDUSD pair. Traders should also anticipate upcoming Australian inflation data that will drive volatility in the near future.
Resistance & Support
The above financial market data, quotes, charts, statistics, exchange rates, news, research, analysis, buy or sell ratings, financial education, and other information are for reference only. Before making any trades based on this information, you should consult independent professional advice to verify pricing data or obtain more detailed market information. 1uptick.com should not be regarded as soliciting any subscriber or visitor to execute any trade. You are solely responsible for all of your own trading decisions.