

 |
| Gold V.1.3.1 signal Telegram Channel (English) |
GBPUSD Technical & Fundamental Analysis: Breaking Key Support Levels Signals Short-Term Pressure, August 28, 2026
2026-08-28 @ 13:01
Over the past 24 to 48 hours, the GBP/USD pair has traded within a narrow range around 1.358 to 1.360, with yesterday’s closing price at 1.35885. The pair slightly retreated from earlier highs just under 1.3700, displaying a consolidation phase as upward momentum eased.
The main driver behind this price action is the market’s cautious stance ahead of the upcoming Federal Reserve interest rate guidance. As highlighted by the recent headline “British Pound Sterling borrows a month it did not earn,” the pound’s recent gains appear borrowed from unrealized momentum, failing to break through resistance convincingly. Meanwhile, persistent U.S. inflation data has dampened expectations for further Fed hikes, boosting the U.S. dollar index (DXY) and thus weighing on GBP/USD.
For the average investor, this means the pound’s recent rally should not be taken for granted; the currency’s movement largely reflects shifts in expectations rather than a fundamental change. Ahead of the Fed’s statement, traders are exercising caution, resulting in limited volatility and minimizing short-term risks in the pair.
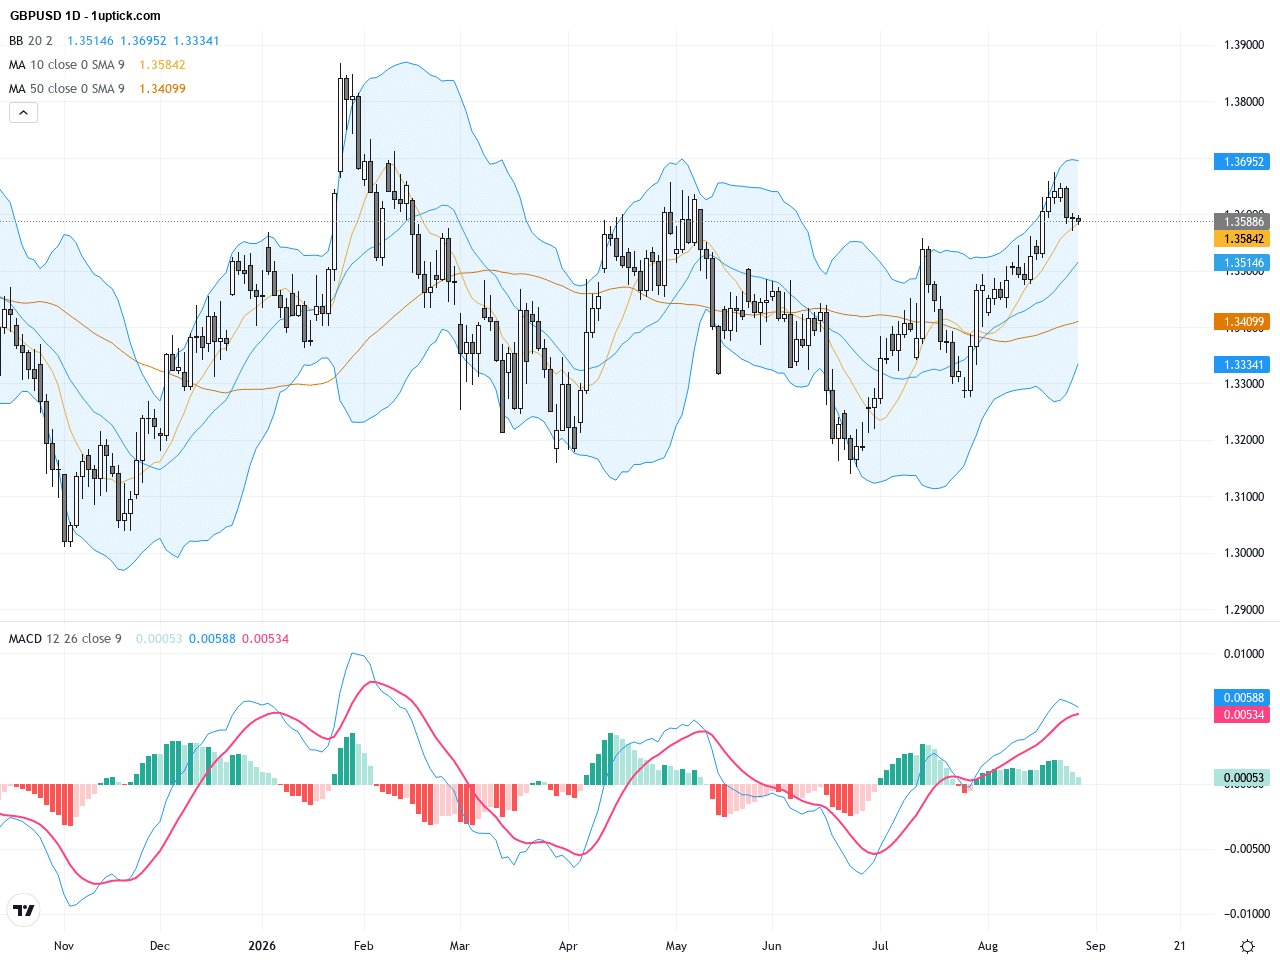
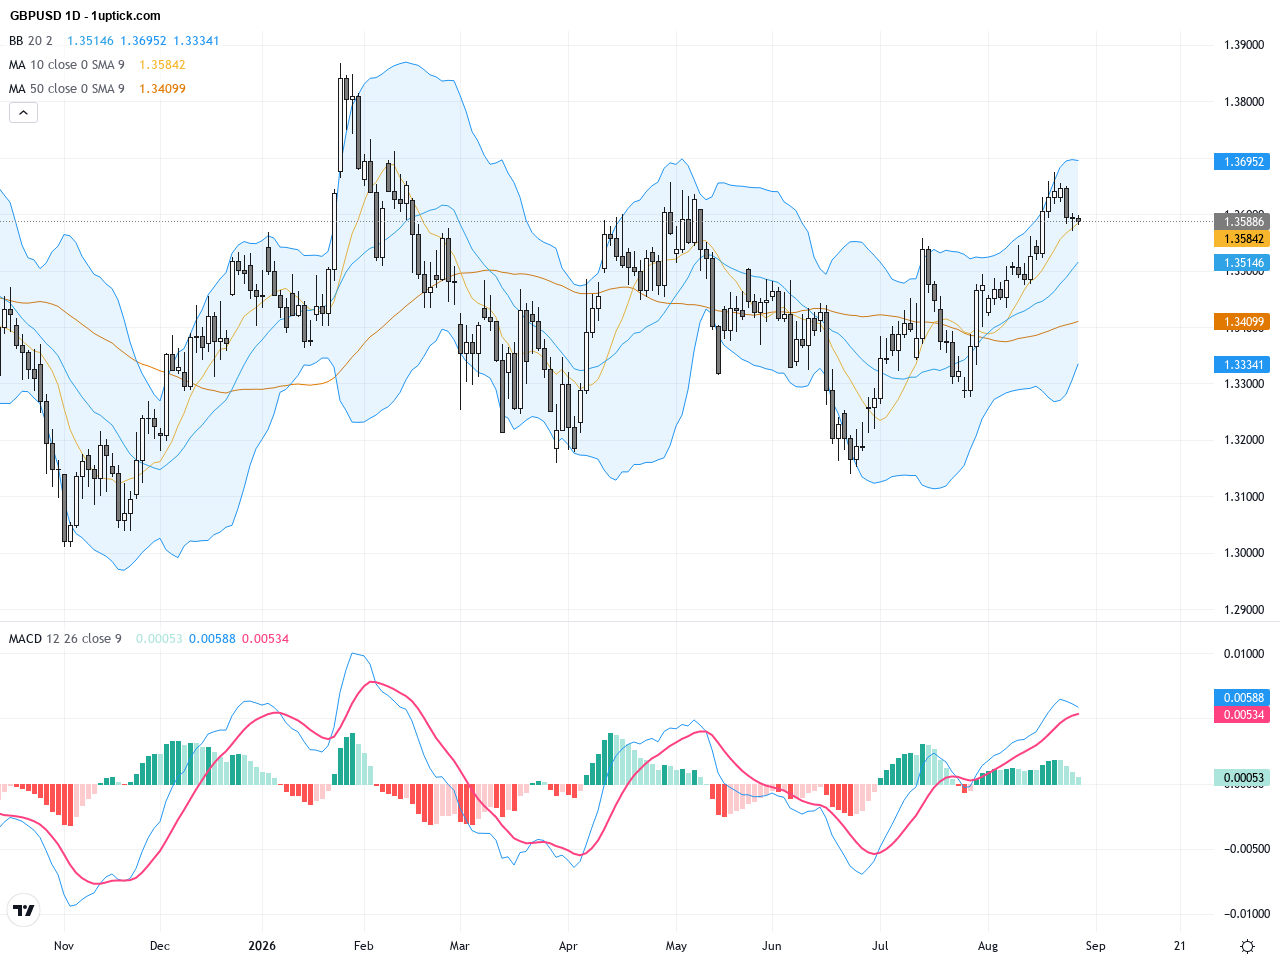
The daily chart shows GBPUSD in a consolidation and slight downtrend phase after nearing the 1.37 resistance level at the end of July. The price has recently dipped below the 20-day moving average and trades within the 1.3550 to 1.37 range. Bollinger Bands have contracted indicating reduced volatility, with price repeatedly touching the mid-band acting as resistance. The EMA lines are intertwined showing no clear trend direction, while MACD momentum is weakening, confirming indecision in the market and suggesting a fragile bearish bias.

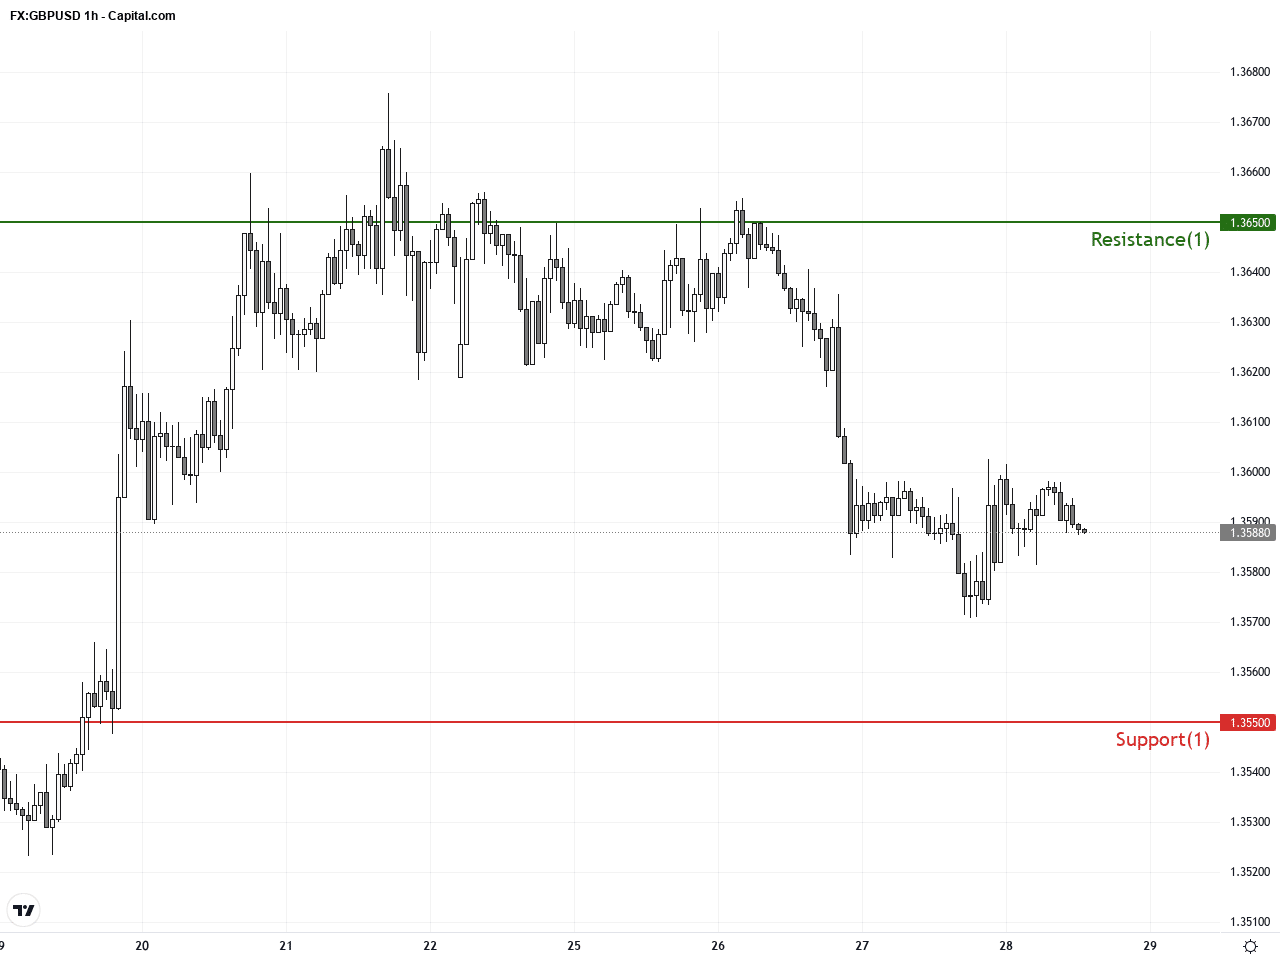
The hourly chart over the past five days reveals GBPUSD’s failed attempts to breach the 1.3650 resistance, followed by pullbacks to support at 1.3560. Prices are currently near the lower Bollinger Band with short-term EMAs arranged bearishly (5 and 10 EMA crossed downward). The MACD exhibits a bearish crossover, adding momentum to the downside. Recently, a bearish engulfing candlestick pattern signals potential further weakening in the next 24 hours, indicating possible retest of lower support levels.
Technical Trend: The current short-term trend for GBPUSD is cautiously bearish, trading within a narrowing range and showing signs of consolidation biased to the downside.
Key technical insights show GBPUSD has broken beneath the daily 20-day moving average, reinforcing short-term weakness. The hourly MACD bearish crossover and bearish engulfing candlestick provide clear momentum shift signals to watch. Bollinger Bands contraction foreshadows potential volatility expansion. Traders should monitor critical breakouts below 1.3550 support or above 1.3650 resistance for directional bias. A breakdown suggests further declines toward 1.3500, while reclaiming resistance could yield a rebound opportunity.Today’s economic calendar highlights the Jackson Hole Symposium at around 20:00 HKT, an event known for its potential market-moving Fed policy signals. Although no direct UK or US macroeconomic data is scheduled today, traders will closely eye Fed commentary for hints on monetary policy direction which could strongly influence GBPUSD. Other released data such as Japan’s CPI and unemployment rates bear minimal impact on this pair. Overall, the focus remains on policy speculation with potential high volatility ahead.
Resistance & Support
The above financial market data, quotes, charts, statistics, exchange rates, news, research, analysis, buy or sell ratings, financial education, and other information are for reference only. Before making any trades based on this information, you should consult independent professional advice to verify pricing data or obtain more detailed market information. 1uptick.com should not be regarded as soliciting any subscriber or visitor to execute any trade. You are solely responsible for all of your own trading decisions.