


 |
| Gold V.1.3.1 signal Telegram Channel (English) |
USDJPY Outlook: Key Resistance at 159.50 Tested Amid Japan Inflation Data and Technical Patterns, August 28, 2026
2026-08-28 @ 11:01
Over the past 24 to 48 hours, the USD/JPY pair has exhibited steady but modest gains, trading within a narrow range between 159.30 and 159.50, with yesterday’s closing price at 159.434. Despite the release of Japan’s consumer price index (CPI) data during this period, the market reaction was muted as the pair remained stuck near the 159 level, reflecting a market sentiment that “the yen will get its hike regardless of the Tokyo CPI prints.”
Latest reports and analyses highlight that senior Bank of Japan officials have hinted at potential policy shifts, while the U.S. Federal Reserve continues to signal hawkish stances, sustaining dollar strength. This dynamic has resulted in a tug of war around key support and resistance levels for USD/JPY. Additionally, Japanese firms are ramping up currency hedging amid persistent yen weakness, signaling growing unease about the yen’s outlook.
For the average investor, it’s like watching a strategic standoff: the dollar is pushing to break past the yen’s defensive line, but Japan’s economic fundamentals and policy hints are keeping the yen from collapsing. In the coming days, particularly with major events like the Jackson Hole Symposium approaching, the market is likely to remain range-bound, waiting for a clear catalyst to trigger the next directional move.

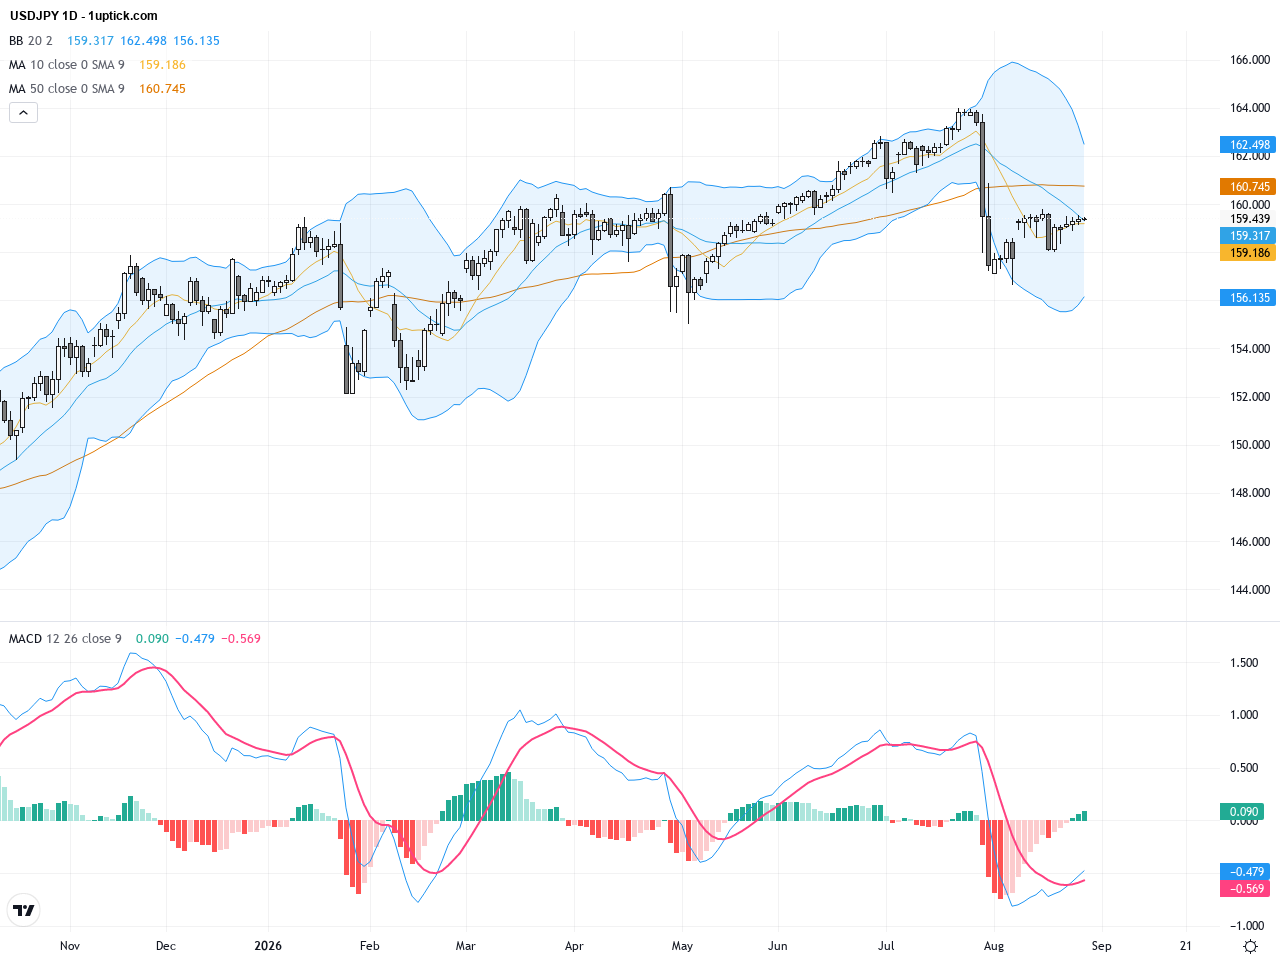
On the daily chart, USDJPY displays a strong uptrend since the yearly low of 146.217, with prices holding above the 200-day moving average at 158.38, signaling medium to long-term bullishness. The pair recently faces stiff resistance around 159.50, forming a short-term consolidation band. Bollinger Bands are narrowing, suggesting low volatility, while the MACD stays above zero but shows signs of momentum easing. Overall, the longer-term trend is bullish but caution is warranted for potential range breakouts or pullbacks.
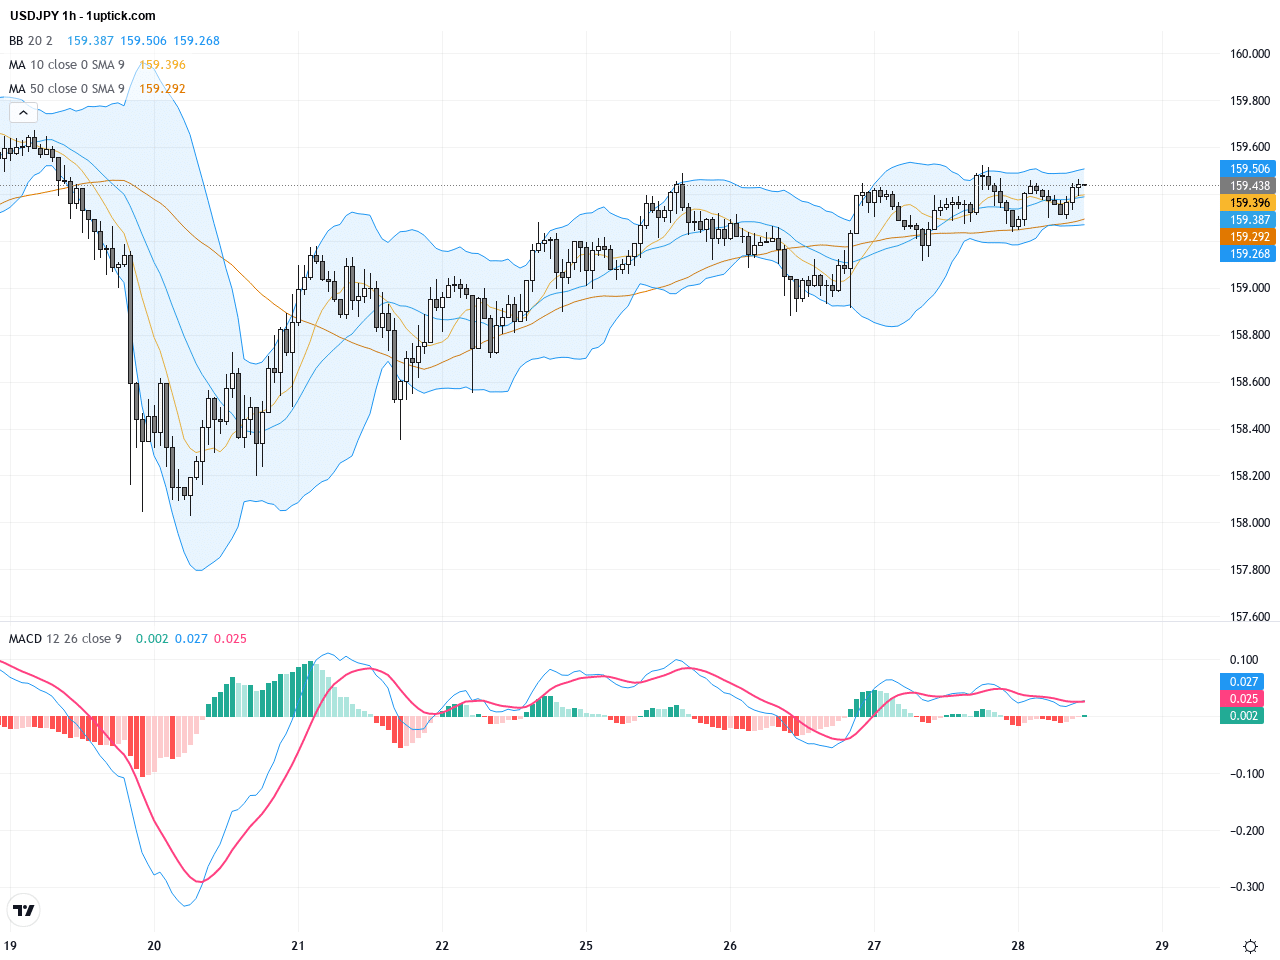
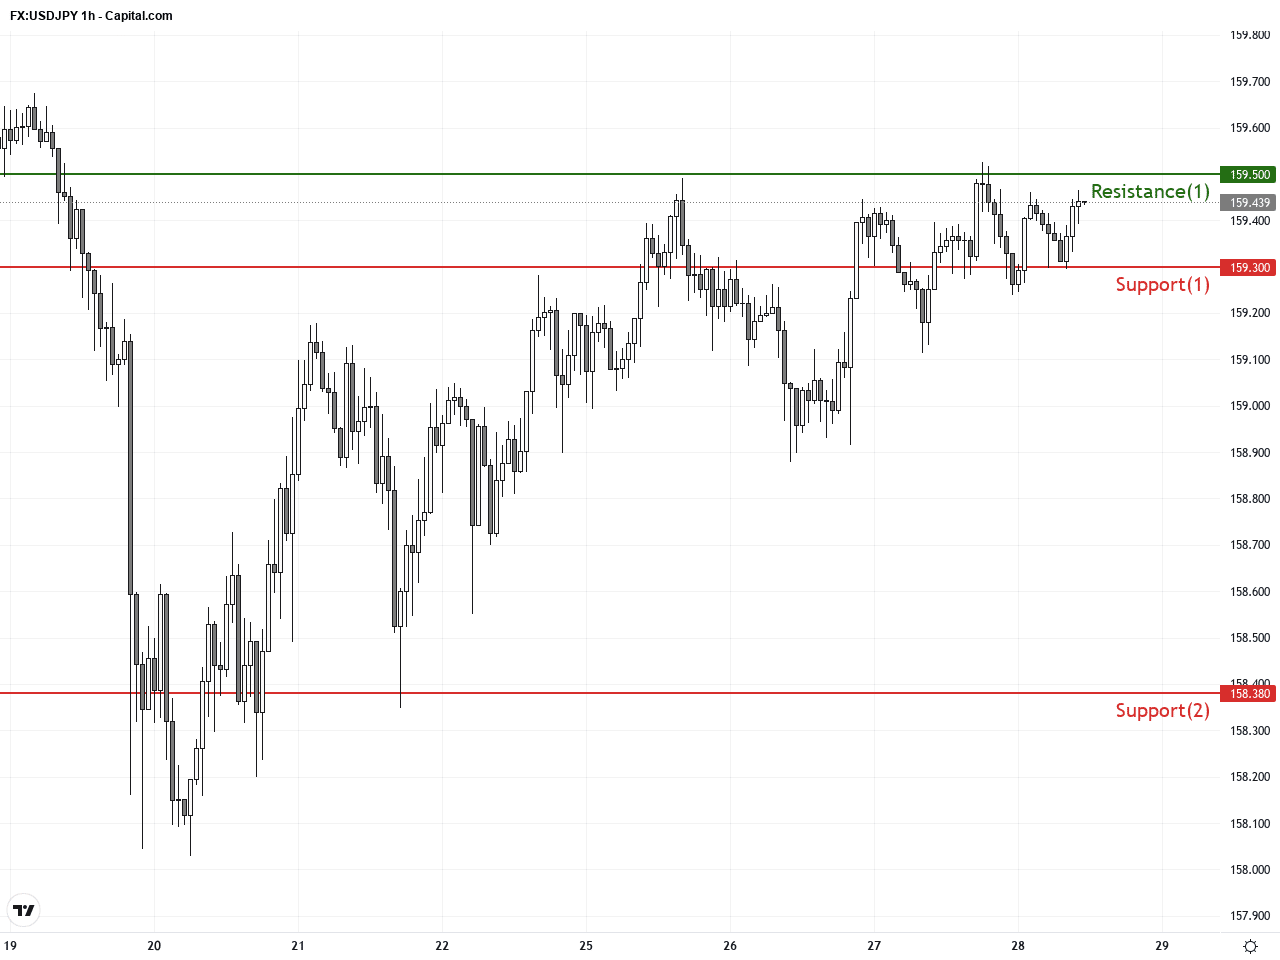
The hourly chart over the last 3-5 days shows USDJPY consolidating between 159.30 and 159.50, with the 50- and 20-hour moving averages entangled, indicating indecision. The MACD is displaying bearish divergence, and volume is tapering off, signaling decreased momentum. A small flag pattern is forming, and an upside break above 159.50 could trigger renewed buying interest, while a break below 159.30 may prompt short-term weakness.
Technical Trend: USDJPY is currently in a cautiously sideways consolidation phase within an overall bullish trend.
Technically, USDJPY’s daily chart maintains an overall bullish trend but is encountering repeated resistance near 159.50, suggesting notable selling pressure there. The hourly flag consolidation coupled with MACD bearish divergence hints at short-term volatility ahead. Recent candlestick patterns show indecision with multiple small doji formations, emphasizing market hesitation. Traders should watch for a clear breakout or breakdown from current levels to confirm the next directional move.Japan released its core Consumer Price Index for August at 1.8% year-over-year, slightly above the expected 1.7%, and the unemployment rate ticked down to 2.4% versus a forecast of 2.5%. These data provide near-term support for the yen. Meanwhile, market focus remains on tonight’s US Federal Reserve Jackson Hole Symposium for policy clues. There are no other significant events today with a direct impact on USDJPY. Overall, the Japanese data benefits the yen in the short-term, but global rate outlooks will be the decisive factor.
Resistance & Support
The above financial market data, quotes, charts, statistics, exchange rates, news, research, analysis, buy or sell ratings, financial education, and other information are for reference only. Before making any trades based on this information, you should consult independent professional advice to verify pricing data or obtain more detailed market information. 1uptick.com should not be regarded as soliciting any subscriber or visitor to execute any trade. You are solely responsible for all of your own trading decisions.