

 |
| Gold V.1.3.1 signal Telegram Channel (English) |
XAUUSD Gold Price Technical Breakout: Confirming Bullish Flag and Key Support Rebound, August 28, 2026
2026-08-28 @ 05:04
Over the past 24 to 48 hours, gold (XAUUSD) has experienced volatile consolidation, with yesterday’s closing price at $4604.425. The market’s primary driver has been the US July Personal Consumption Expenditures (PCE) data, where stable inflation numbers have eased some market concerns, helping gold maintain its elevated level.
The recent bullish performance in US stocks, notably Nvidia’s strong earnings report sparking market enthusiasm, has limited direct impact on gold but illustrates a diversified global asset allocation environment. In the gold market, the strengthening USD following the PCE release and rising Federal Reserve rate hike expectations have pressured gold prices, leading to some short-term pullback, signaling investors’ cautious stance on monetary policy direction.
For the average investor, the gold market remains closely tied to macroeconomic data fluctuations. Steady inflation could reduce the likelihood of aggressive Fed rate hikes, supporting gold’s appeal as an inflation hedge. Conversely, sustained USD strength may cause short-term corrections, but gold’s position near a three-month high underscores its ongoing role as a safe-haven asset.
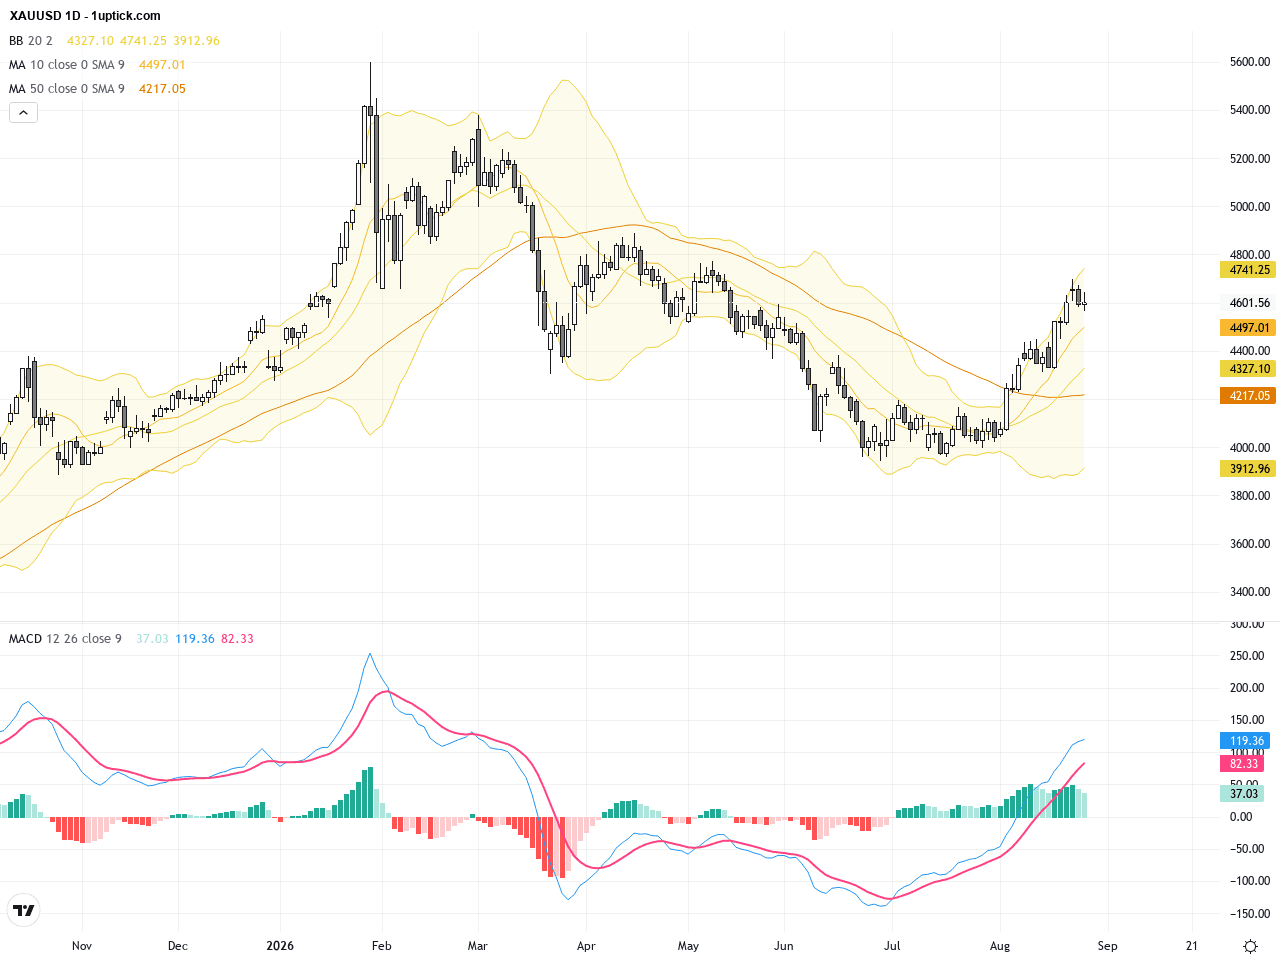
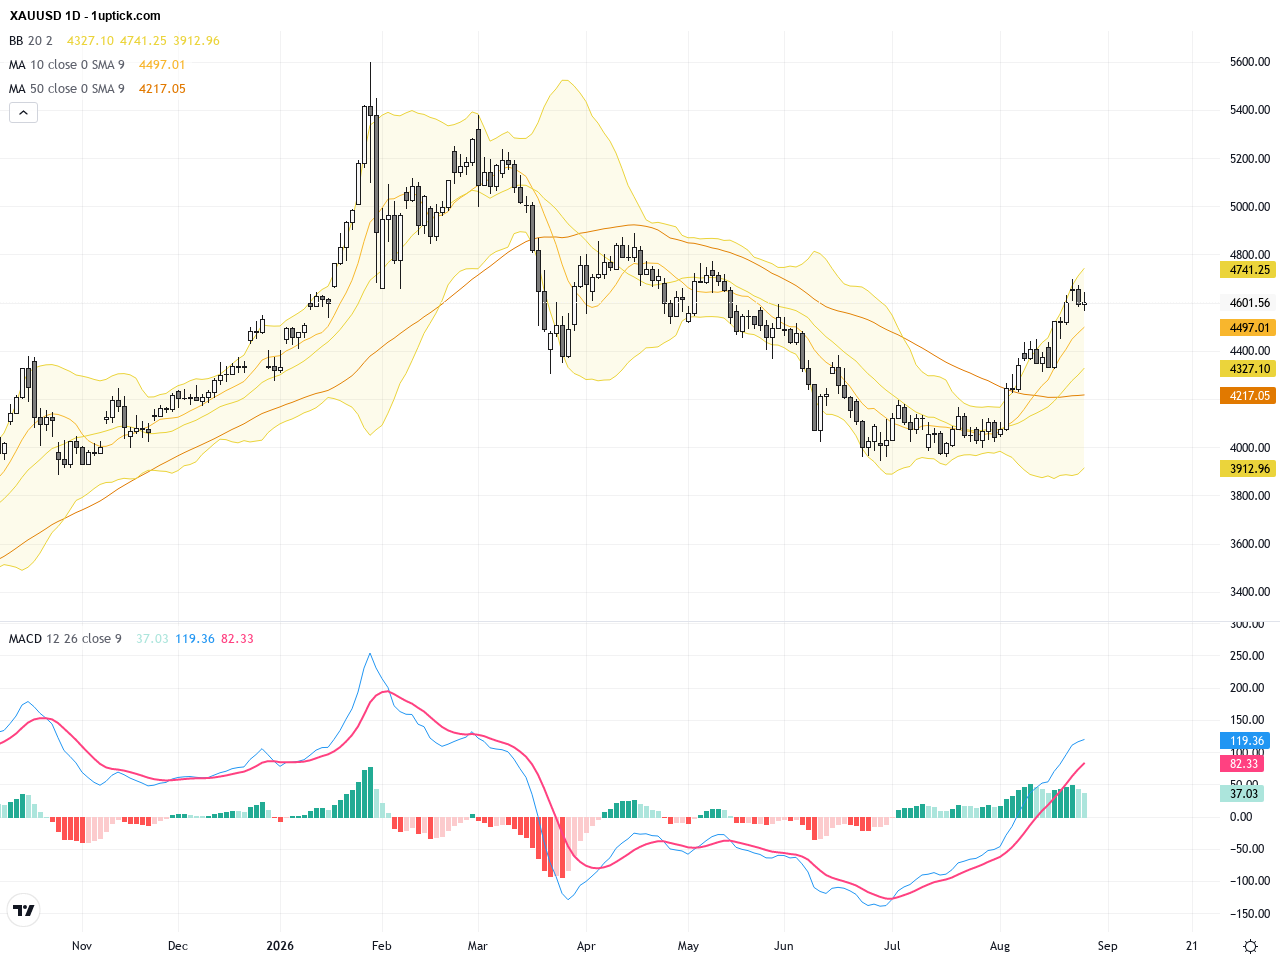
The daily chart depicts a sustained upward trend in gold prices since early August, with price repeatedly testing and breaking above the 4600 level. A bullish flag pattern emerged starting around August 20, indicating ongoing buying pressure and strong bullish sentiment. Technical indicators show short-term moving averages above the long-term ones with Bollinger Bands tightening, hinting at a potential breakout. MACD remains positive, which supports a medium to long-term bullish outlook.
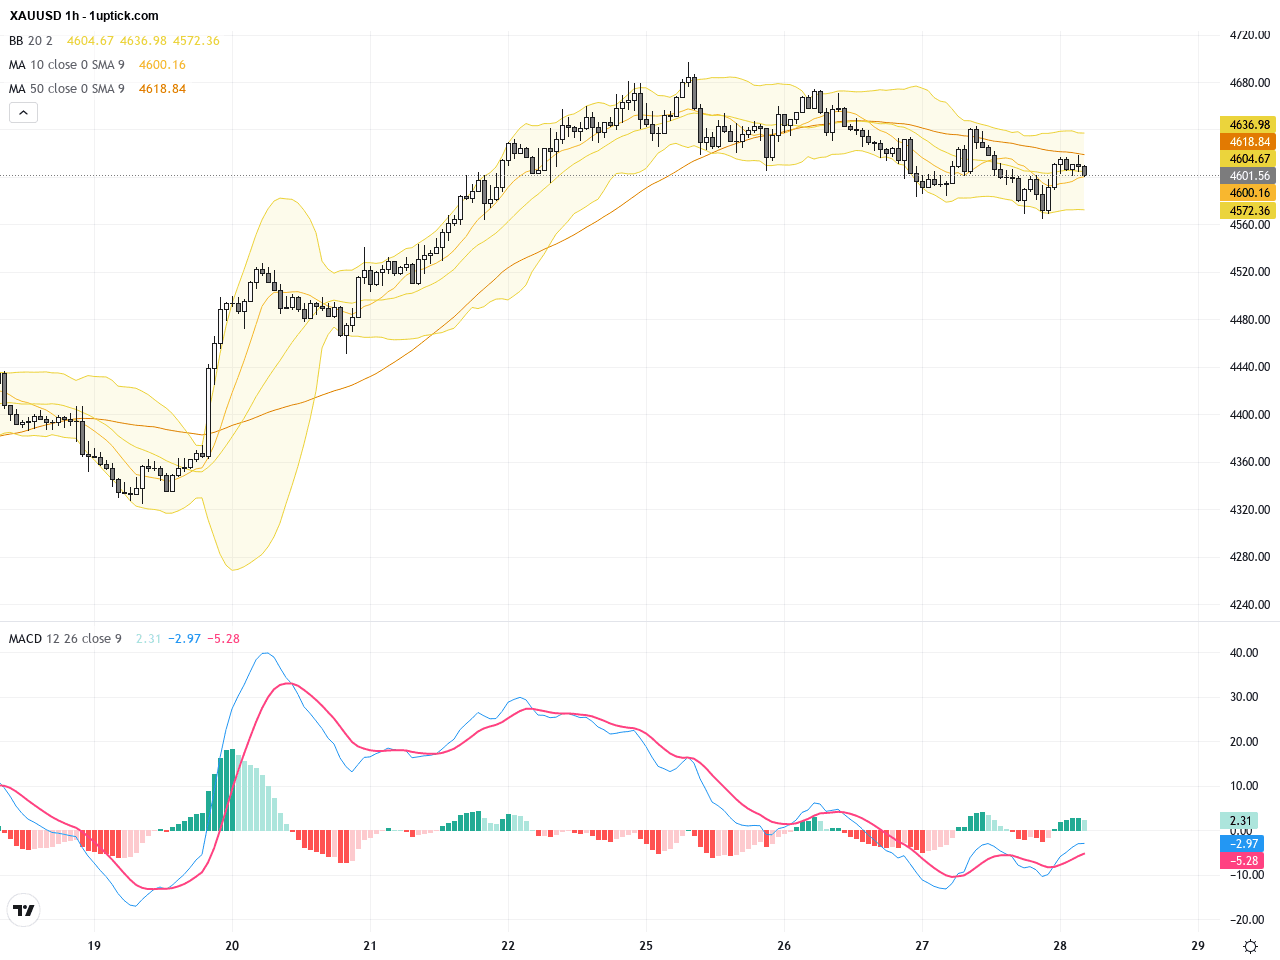
The hourly chart over the past 3-5 days shows a rebound from the low of 4564, with an ascending short-term trend. Price successfully bounced off the 20-period moving average multiple times, now trading near the upper Bollinger Band, indicating an overbought condition and potential for a mild pullback. The MACD is close to a bullish crossover, signaling a possible short-term momentum boost. A recent engulfing candlestick suggests strong buying pressure but warns to watch for short-term volatility.
Technical Trend: The daily and hourly trend indicates XAUUSD is in a steady bullish phase, best described as ‘cautiously optimistic’, with short-term pullbacks possible but the bulls clearly in control overall.
Technically, XAUUSD is breaking out of a bullish flag pattern, with a clear upwards short-term trend but caution warranted due to the overbought condition at the upper Bollinger Band. The approaching MACD golden cross could reinforce bullish momentum. Daily moving average alignments remain supportive of the medium-term trend, giving investors solid levels for entry and exit points based on clear support and resistance zones.Today’s GMT+1 economic calendar reveals no significant or direct events expected to impact XAUUSD. Although Australia’s Q2 private capital expenditure unexpectedly declined and there are releases on EU and US trade data, these carry low market impact. Therefore, gold price moves today will likely be driven by technical patterns and market sentiment rather than economic releases.
Resistance & Support

The above financial market data, quotes, charts, statistics, exchange rates, news, research, analysis, buy or sell ratings, financial education, and other information are for reference only. Before making any trades based on this information, you should consult independent professional advice to verify pricing data or obtain more detailed market information. 1uptick.com should not be regarded as soliciting any subscriber or visitor to execute any trade. You are solely responsible for all of your own trading decisions.