

 |
| Gold V.1.3.1 signal Telegram Channel (English) |
USDJPY: Technical Bearish Reversal Highlights Yen Strength Amid Market Intervention, September 4, 2026
2026-09-04 @ 11:01
Over the past 24 to 48 hours, the USD/JPY market has experienced notable volatility. Starting from yesterday’s closing price of 156.07, the pair declined sharply, touching about 156.40 on September 3, marking a drop of over 1.3%. This sharp fall is mainly driven by the resurgence of the Japanese yen amid shifting Bank of Japan (BoJ) policies and rising expectations of yen intervention, putting significant pressure on the US dollar.
Headlines such as “Dollar plunges over 2% against yen marking largest one-day drop since official intervention” and “BoJ’s hawkish stance fuels yen’s strong rebound” clearly depict this scenario. The yen’s strength not only weakened the dollar but also dragged down the US Dollar Index (DXY), with market speculation mounting around BoJ’s possible currency intervention to curb yen weakness. Additionally, the yen surge pushed Japanese Government Bond yields higher, attracting domestic capital and slowing US Treasury purchases, creating a ripple effect.
For average investors, this translates into heightened volatility in dollar-denominated assets, particularly the USD/JPY exchange rate, which will test risk management strategies of multinational corporations and forex traders. Meanwhile, the yen’s rapid appreciation puts pressure on funding strategies relying on Japanese yen, such as carry trades, forcing reevaluations. The reset in the USD/JPY dynamic signals a potential shift in global capital flows, emphasizing the need to closely monitor BoJ policy signals and market responses to intervention moves in the near term.
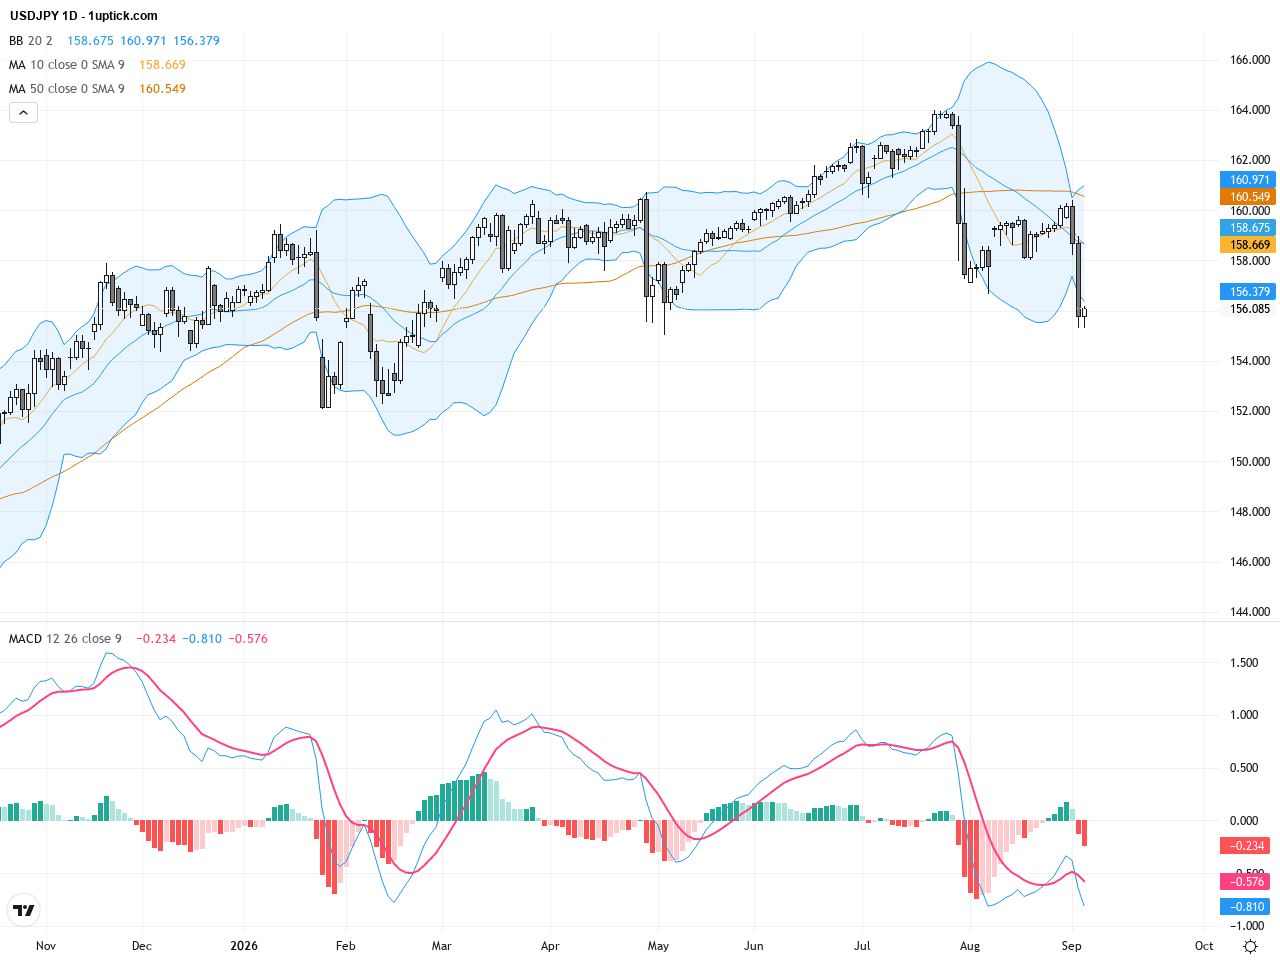
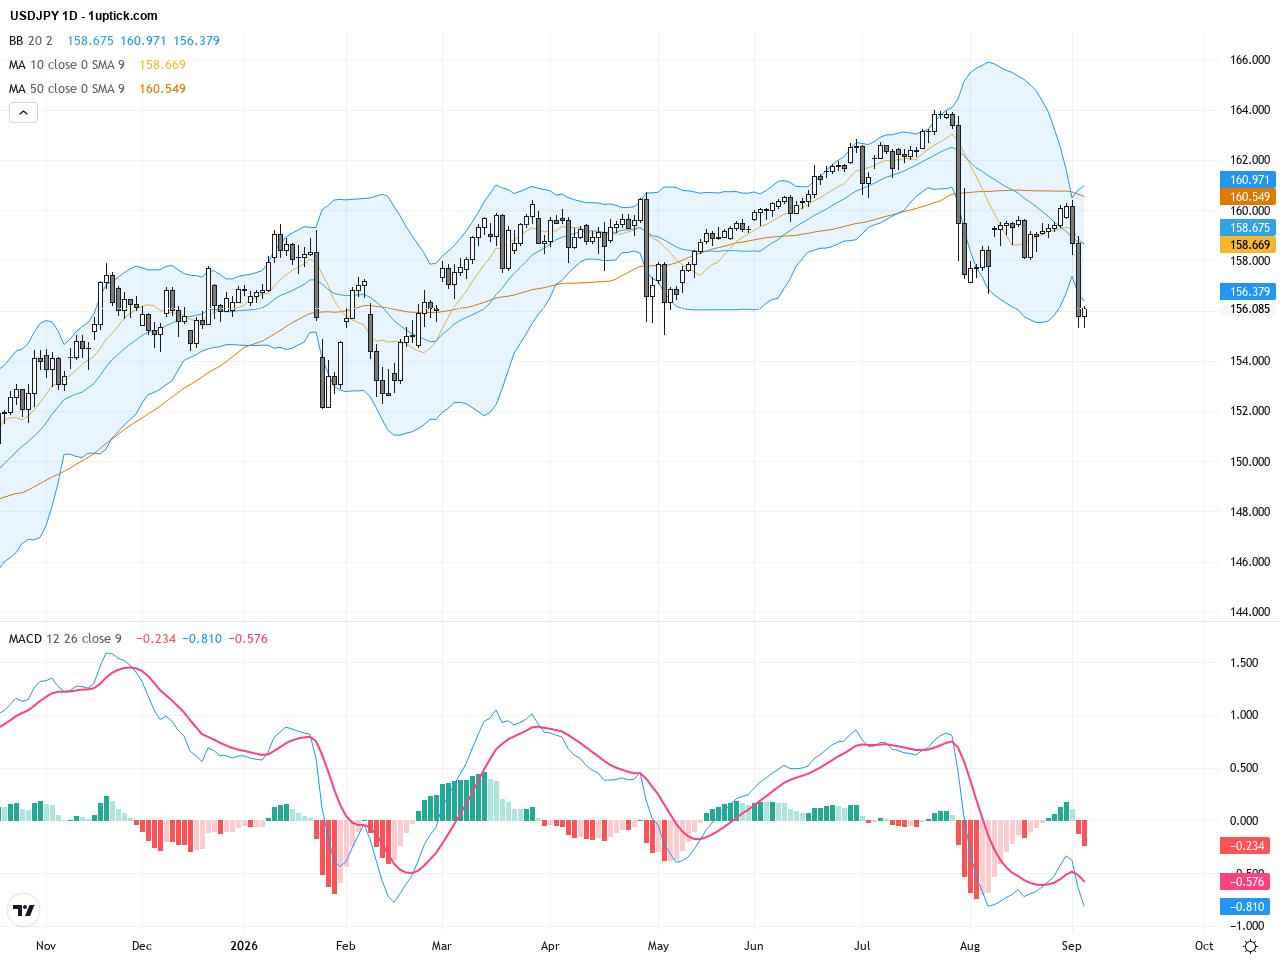
The daily chart shows a clear downtrend for USDJPY, with prices breaking below the 200-day and 50-day moving averages located near 158.45 and 160.75 respectively. The pair has pulled back to levels around 156, signaling weakening bullish momentum. The Bollinger Bands are contracting, indicating reduced volatility, while the MACD has formed a bearish crossover in negative territory, further confirming the bearish trend. The overall picture suggests a continuation of downside movement or consolidation below key moving averages.
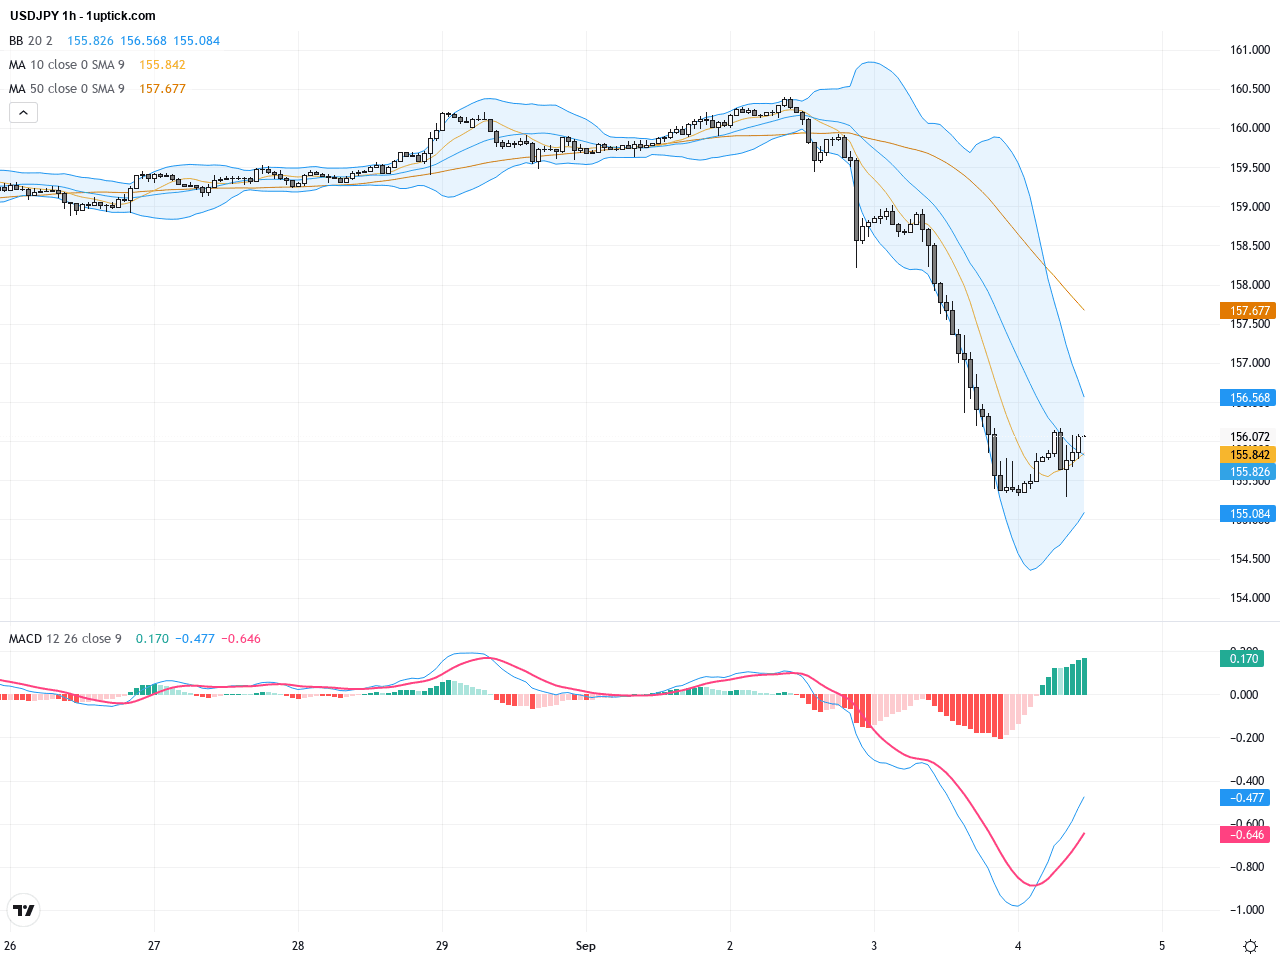
The hourly chart over the past 3 to 5 days reveals volatile but predominantly bearish price action. Attempts to break higher have repeatedly failed near the upper Bollinger Band, with 20 and 50-period moving averages aligned downward and converging. The MACD histogram has shrunk but hasn’t shown signs of bullish momentum recovery yet. These short-term signals confirm ongoing selling pressure, with the critical support area near 155.30 needing to hold to prevent further declines.
Technical Trend: Cautiously Bearish with Sideways Bias
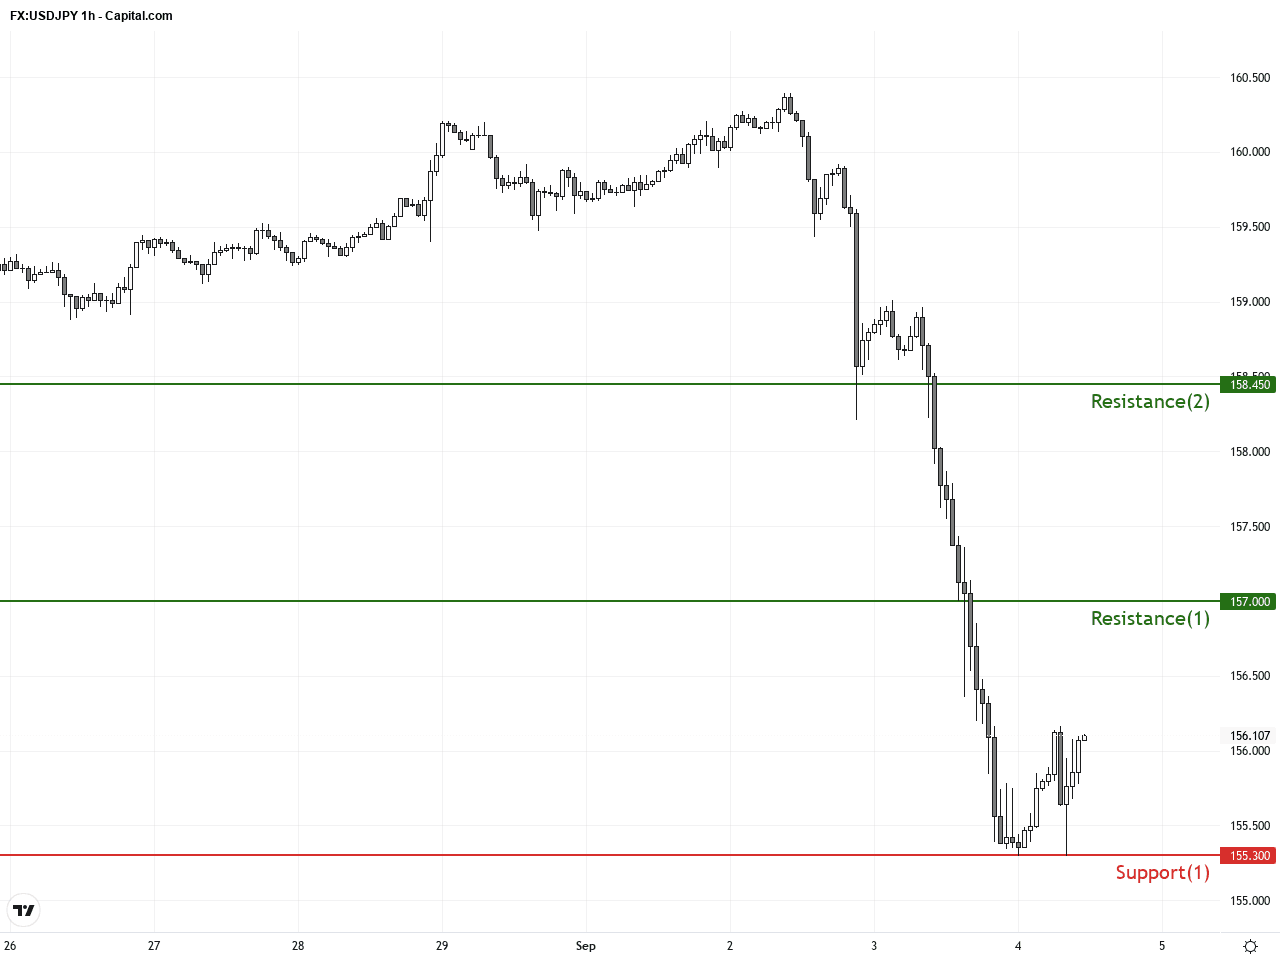
Technical analysis points to a bearish to neutral bias for USDJPY. The daily MACD bearish crossover combined with price trading beneath key moving averages increases downside risk. Hourly chart attempts to break resistance have failed repeatedly, signaling sellers remain in control. A significant hammer candlestick with a long lower shadow suggests short-term buying interest, but momentum isn’t strong enough to counter the overall downtrend. Key levels at 155.30 support and 157.00 resistance will guide the next meaningful price moves.In today’s GMT+1 economic calendar, the key data relevant for USDJPY is Japan’s July Household Spending, which registered a 3.6% year-over-year decline, worse than the expected 1.6% decline. This weak consumption data could pressure the yen negatively in the short term. Later in the day, U.S. releases at 14:30 HKT include Non-Farm Employment Change and Unemployment Rate for August. A stronger-than-expected U.S. jobs report would likely support the dollar, potentially adding downward pressure on USDJPY. Hence, market participants should prepare for continued volatility driven by these fundamental contrasts.
Resistance & Support
The above financial market data, quotes, charts, statistics, exchange rates, news, research, analysis, buy or sell ratings, financial education, and other information are for reference only. Before making any trades based on this information, you should consult independent professional advice to verify pricing data or obtain more detailed market information. 1uptick.com should not be regarded as soliciting any subscriber or visitor to execute any trade. You are solely responsible for all of your own trading decisions.