

 |
| Gold V.1.3.1 signal Telegram Channel (English) |
WTI Crude Oil: Approaching Key $94 Resistance Amid Escalating Middle East Tensions, September 8, 2026
2026-09-08 @ 06:03
Over the past 24-48 hours, WTI Crude oil has exhibited significant volatility, reaching an intraday high near $93.29 and closing around $92.7, slightly up from the previous day’s close of $92.7 on September 7. This price surge was primarily driven by escalating tensions between the US and Iran, especially the mutual strikes on commercial vessels in the Strait of Hormuz, seriously threatening supply chain security.
Goldman Sachs warned that if the shipping attacks between the US and Iran intensify, oil prices could soar up to $120 per barrel, reflecting heightened market concerns over supply disruptions. Although there was some speculation that prices might dip towards $80 should Gulf exports normalize, ongoing conflict has clouded supply outlooks, keeping oil prices near six-week highs close to $100 a barrel. Gasoline prices also surged to a Labor Day record of $4.15 per gallon, underscoring the direct cost impact on everyday consumers caused by the conflict.
For the average investor, this scenario is akin to experiencing shortages of essential goods that force up prices; as a cornerstone of the global economy, oil price fluctuations directly affect transportation, heating, and industrial production costs. Overall, the recent sharp moves and price increases in the WTI crude market are fundamentally driven by geopolitical tensions and supply chain security risks in the Middle East. Investors should closely monitor developments in the region to better gauge future price directions.

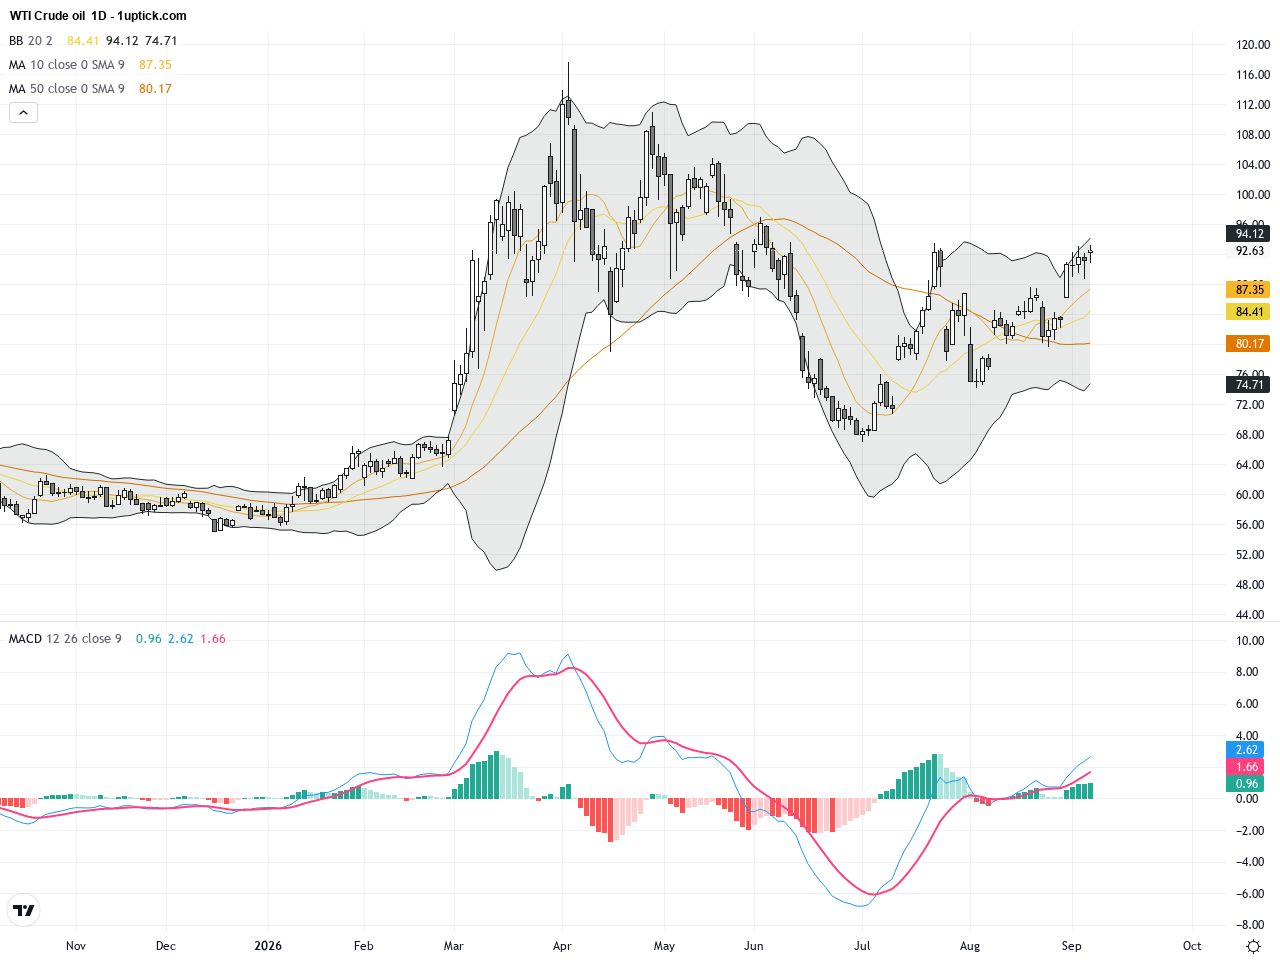
The daily chart of WTI Crude Oil shows a clear bullish trend over recent weeks, with prices rising steadily from a low near $83 at the end of August to just below $94 currently. Bollinger Bands are expanding upwards, indicating increased volatility. Moving averages are aligned bullishly, with short and medium-term MAs (20-day and 50-day) trending up and prices steady above them. The MACD indicator demonstrates stable bullish momentum with fast and slow lines in a positive crossover, signaling trend continuation. Overall, the daily technical setup is healthy and indicates sustained upward price movement approaching key resistance.

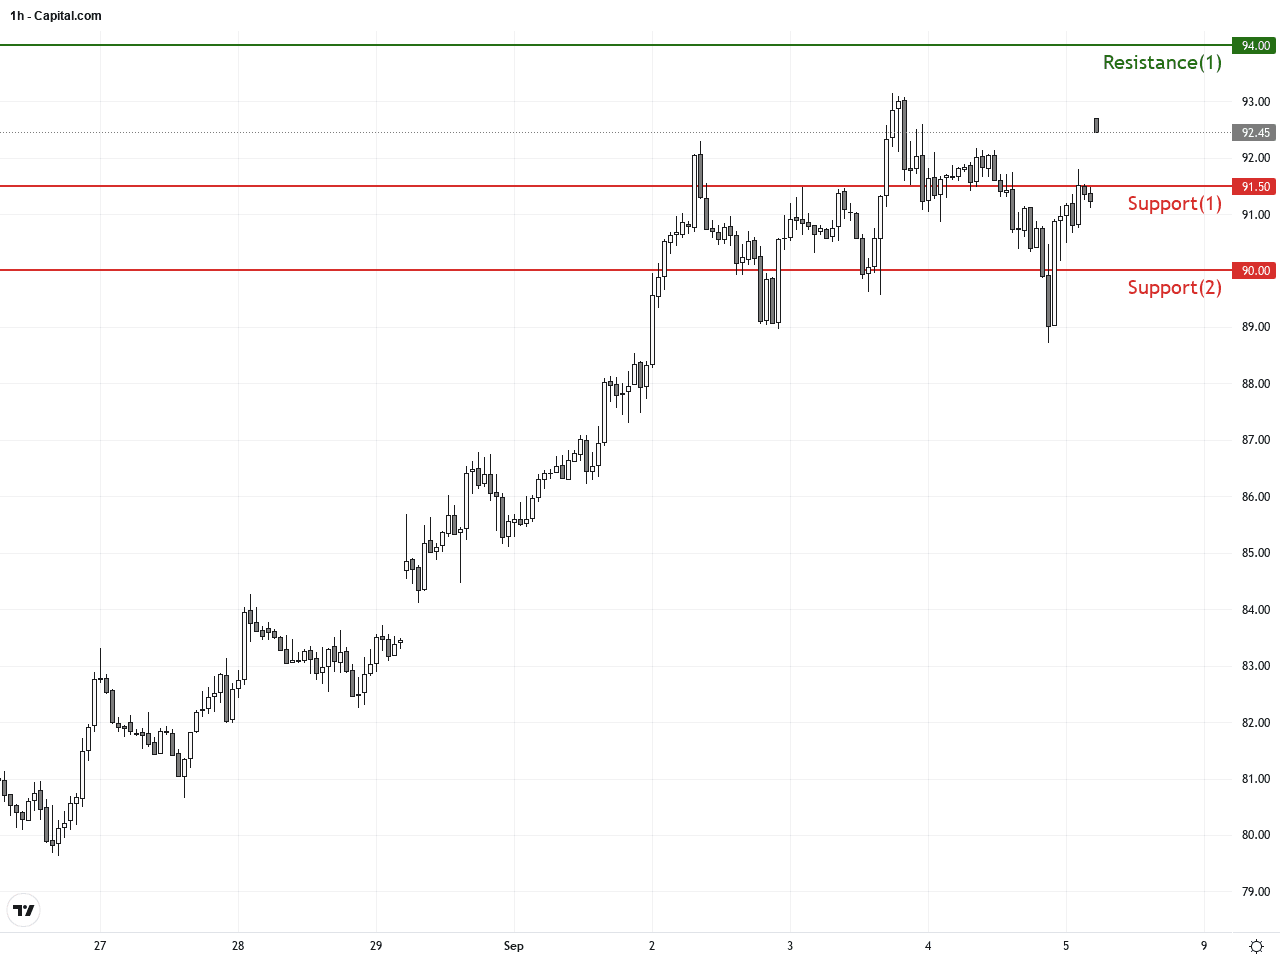
On the hourly chart, WTI Crude Oil’s price action over the past 3-5 days reveals a bullish consolidation pattern with prices testing the $93.5 to $94 range multiple times but facing resistance, forming a minor flag pattern. The MACD has recently formed a bullish crossover, accompanied by a slight increase in volume, suggesting short-term breakout potential. Bollinger Bands indicate solid support near the lower band, with resistance at the upper band. Due to ongoing geopolitical tensions, this consolidation might lead to heightened volatility, requiring traders to watch for decisive breaks to confirm the next directional move.
Technical Trend: WTI Crude Oil is currently in a cautiously optimistic strong uptrend.
Technically, WTI Crude Oil is currently forming a flag consolidation pattern with a solid bullish trend on the daily chart. The recent MACD bullish crossover supports potential continuation of the upward move. Prices are challenging the $94 resistance zone, which if broken decisively, could open the door to further upside gains. The increased volatility tied to geopolitical tensions warrants close monitoring of volume and key moving average supports to confirm the sustainability of the bullish momentum.There are no significant or directly relevant economic events scheduled today that would impact WTI Crude Oil. Given that WTI’s price is primarily influenced by geopolitical tensions and supply concerns, today’s focus remains on Middle East developments and market news driving price action.
Resistance & Support
Run Live WTI Crude Oil Analysis
The above financial market data, quotes, charts, statistics, exchange rates, news, research, analysis, buy or sell ratings, financial education, and other information are for reference only. Before making any trades based on this information, you should consult independent professional advice to verify pricing data or obtain more detailed market information. 1uptick.com should not be regarded as soliciting any subscriber or visitor to execute any trade. You are solely responsible for all of your own trading decisions.