









 |
| Gold V.1.3.1 signal Telegram Channel (English) |
AUDUSD: Momentum Rebound Testing Key 0.7250 Resistance with Strong Technical and Fundamental Insights, September 9, 2026
2026-09-09 @ 06:01
Over the past 24 to 48 hours, the AUD/USD pair experienced some volatility with a slight decline, closing yesterday at 0.7217, down about 0.03% from the previous day. Market sentiment has closely reflected investors’ heightened focus on potential rate hikes by both the Reserve Bank of Australia (RBA) and the Federal Reserve (Fed), leading to adjustments in trading positions.
Despite a stronger-than-expected Australian Q2 GDP report, risk aversion intensified amid hawkish comments from Fed officials, notably Kevin Warsh’s speech at Jackson Hole, which heightened expectations for tighter U.S. monetary policy. The Aussie had previously touched a 15-week high but retreated as sticky inflation data and rising uncertainty weighed on the currency.
For the average investor, this means that even though Australia’s economic fundamentals support the Aussie dollar, global risk-off sentiment and uncertainty over U.S. rate hikes can lead to short-term volatility in AUD/USD. Investors should closely monitor central bank signals and macroeconomic data to manage their exposure and brace for possible price fluctuations.
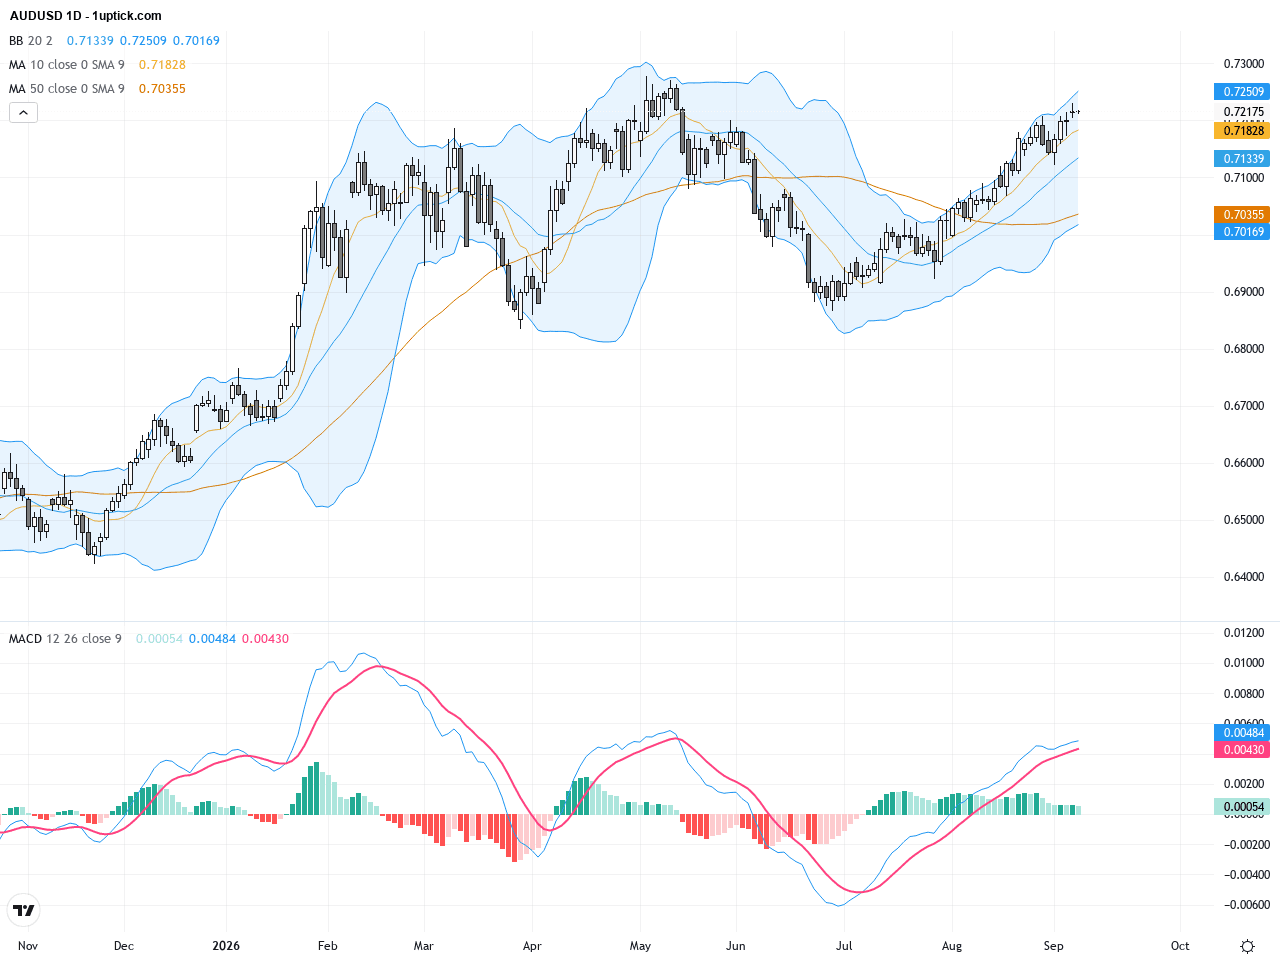
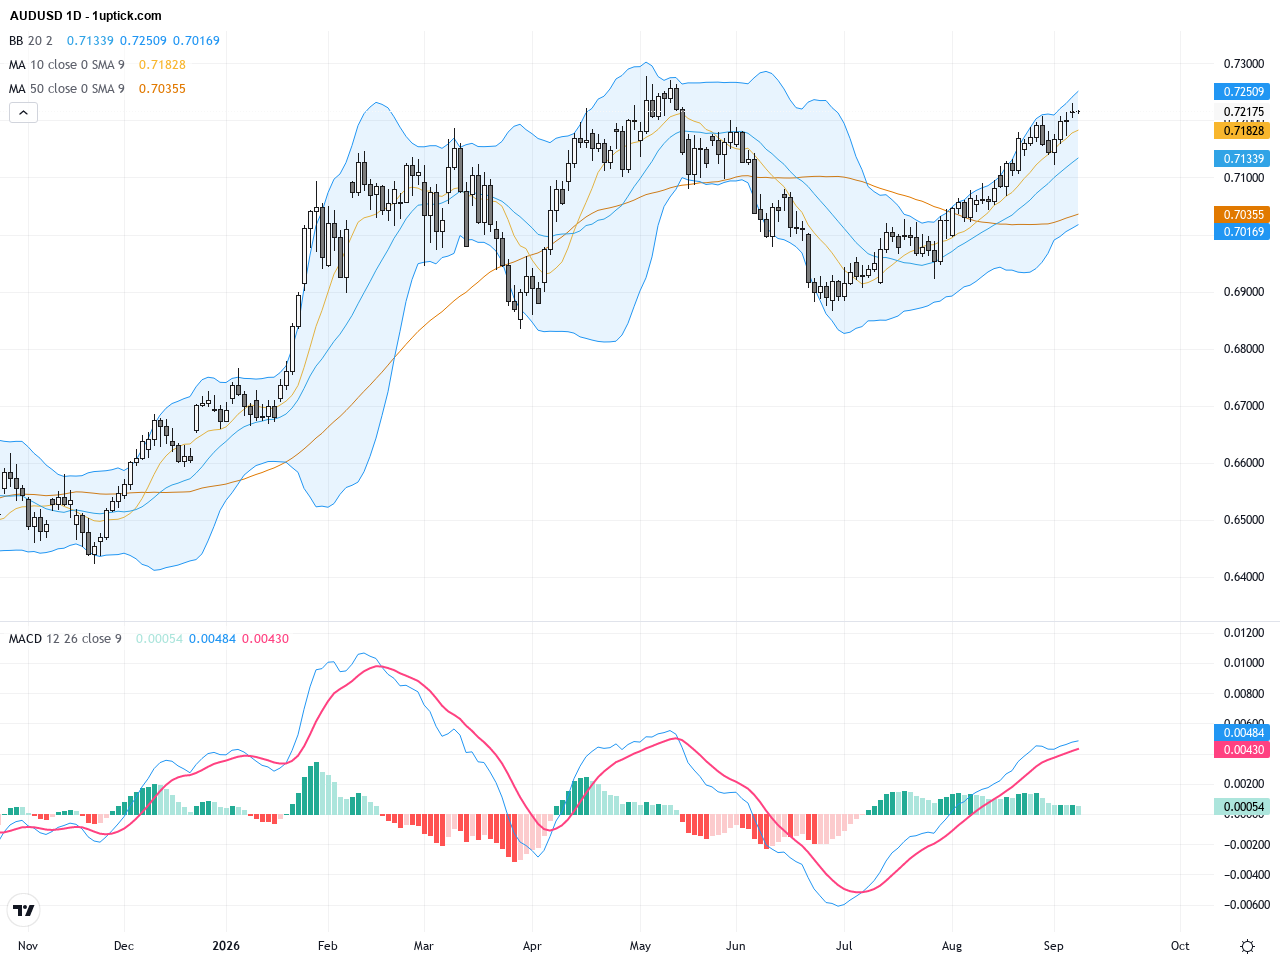
The daily chart shows AUDUSD retreating from a recent high of 0.72774 but maintaining above its 50-day (0.70379) and 200-day (0.69794) moving averages, indicating a mild uptrend. The candlesticks display incremental bullish pressure amid narrowing Bollinger Bands, suggesting a phase of consolidation before a directional move. The MACD remains above zero, maintaining a bullish bias but momentum is gradually fading, signaling the need to watch for potential reversals or breakouts. Overall, the longer-term trend remains cautiously bullish.
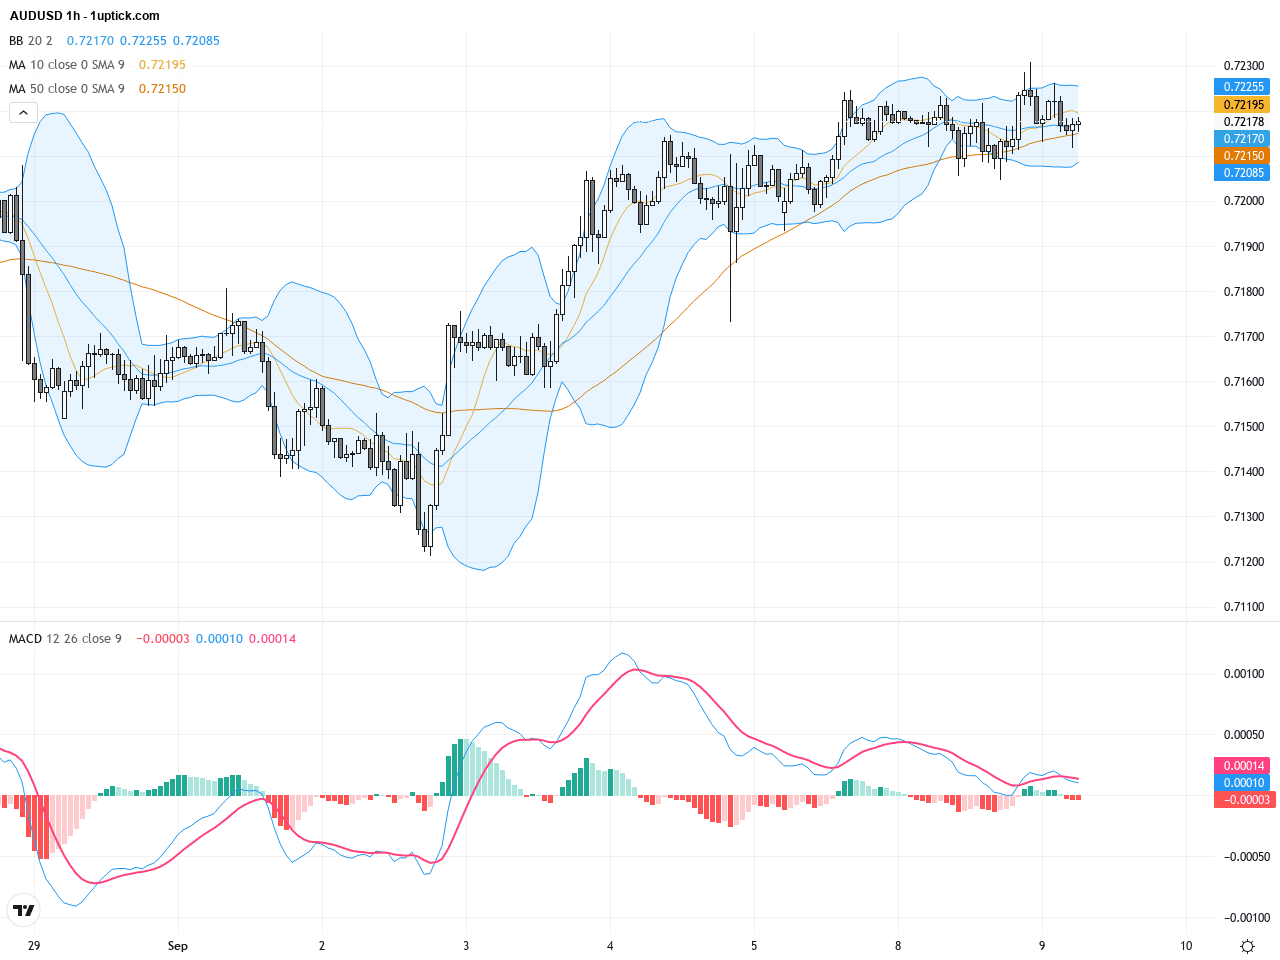
On the hourly chart spanning the past 3-5 days, AUDUSD has oscillated between 0.7200 and 0.7240, recently breaking a critical descending trendline, signaling short-term bullish momentum. The latest candlestick forms a bullish engulfing pattern suggesting continuation of upward movement in the next 24 hours. MACD shows a bullish crossover and RSI approaches but hasn’t reached overbought territory. The expanding Bollinger Bands hint at possible further price action upwards, with 0.7250 as a key resistance level to watch.
Technical Trend: Cautiously bullish trend
Technically, an emerging inverse head-and-shoulders pattern at recent lows signals strengthening bullish momentum. The bullish engulfing candlestick on the hourly chart confirms short-term buying interest. Momentum indicators like MACD and RSI support the upward push, while Bollinger Band contraction warns of limited volatility for now. Watching for a decisive break above 0.7250 resistance is crucial as it could validate the recovery and pave the way for further gains.Today’s economic calendar, set in GMT+1, highlights Poland’s interest rate data and China’s August CPI and PPI releases. While China’s inflation metrics are expected to rise slightly, their direct impact on AUDUSD is minimal. No major events directly influencing AUDUSD are scheduled for today. Market attention remains primarily on Australian and US monetary policy guidance for direction, hence no significant immediate catalysts from today’s data.
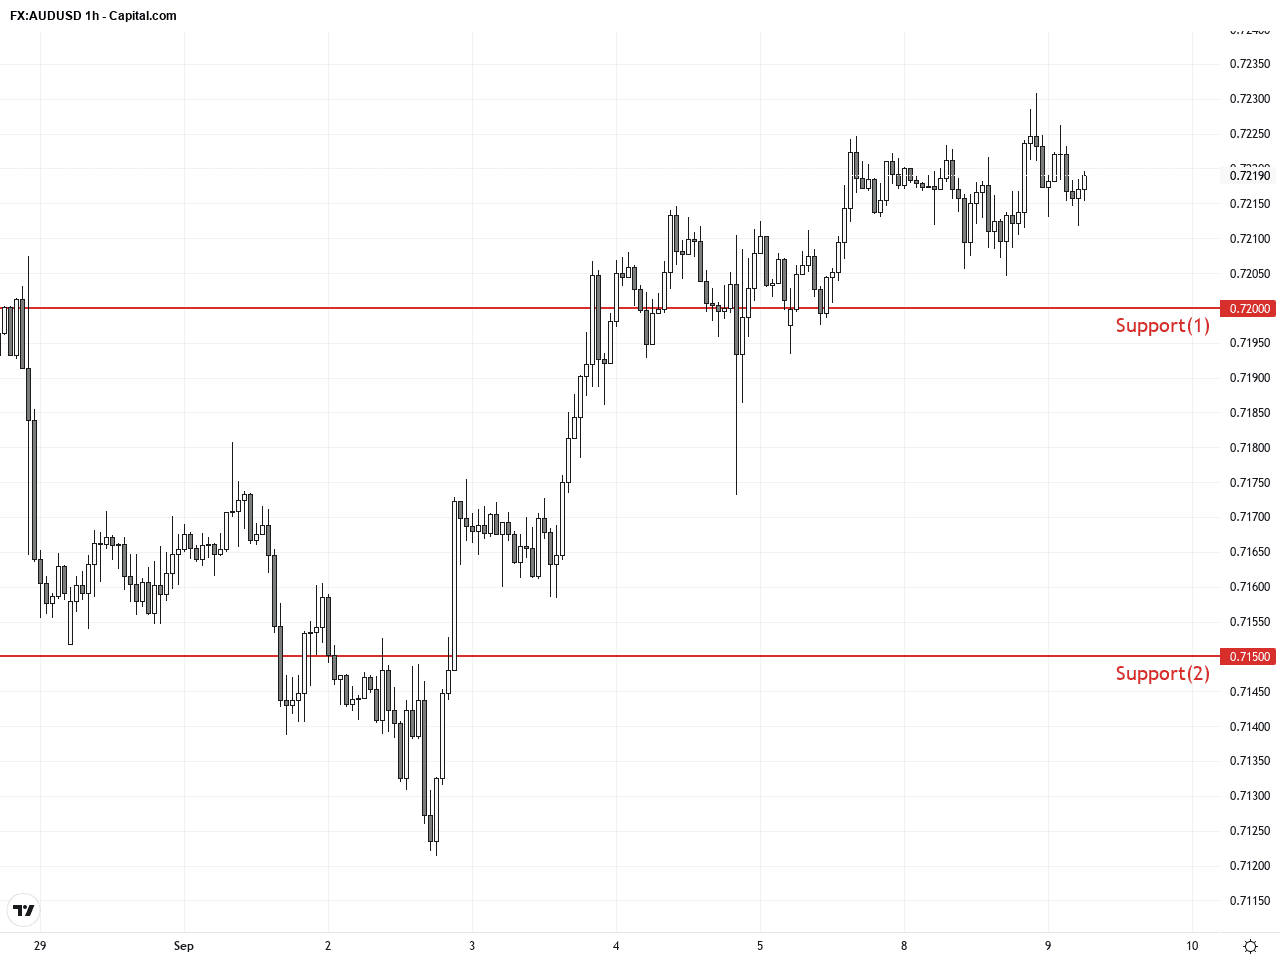
Resistance & Support
The above financial market data, quotes, charts, statistics, exchange rates, news, research, analysis, buy or sell ratings, financial education, and other information are for reference only. Before making any trades based on this information, you should consult independent professional advice to verify pricing data or obtain more detailed market information. 1uptick.com should not be regarded as soliciting any subscriber or visitor to execute any trade. You are solely responsible for all of your own trading decisions.