


 |
| Gold V.1.3.1 signal Telegram Channel (English) |
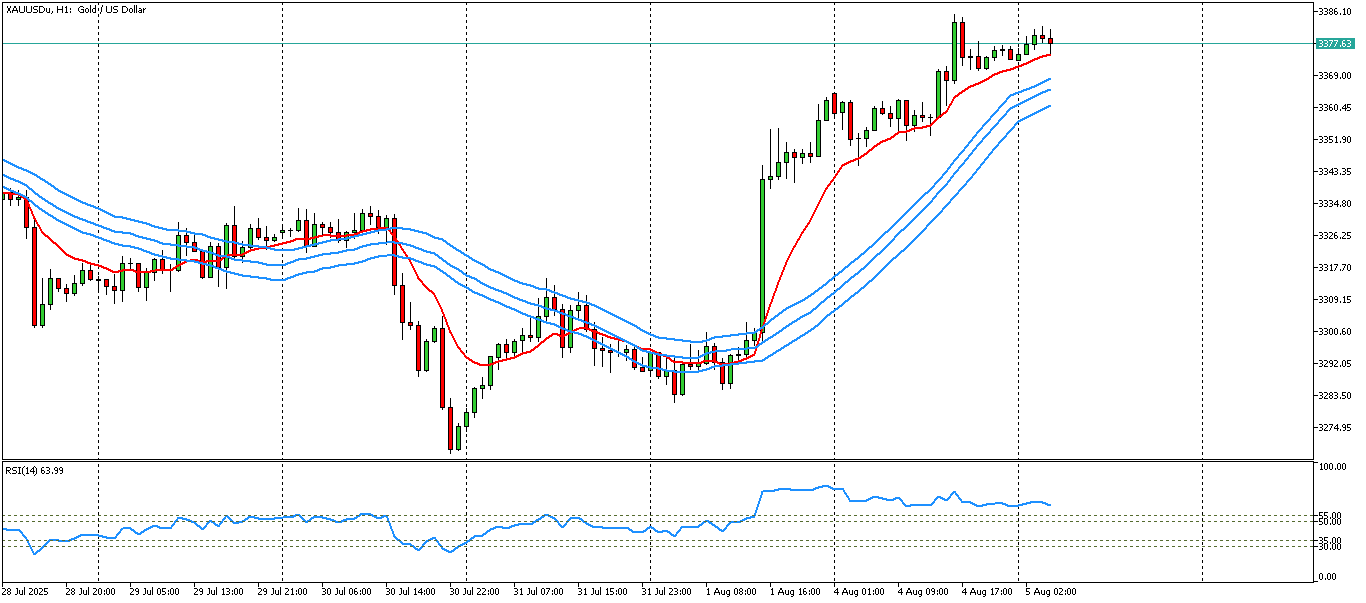
XAUUSD-1 hour
2025-08-05 @ 10:40
Market Overview
Gold (XAUUSD) has experienced volatile movement over the past week, dropping sharply from the $3,435/oz area to lows near $3,270/oz before finding support and rebounding to hover around $3,358–$3,380/oz. This turbulence was triggered by concerns over new US trade tariffs and growing expectations of a Federal Reserve rate cut after weak US labor data. Technical factors have also played a key role: a bearish monthly close indicated profit-taking and seller momentum, while buyers re-entered near the 100-day moving average. The gold market remains sensitive to macroeconomic news, with immediate resistance at $3,300–$3,350/oz and support at $3,244–$3,200/oz. Investor focus is now on US policy signals and central bank guidance for the next directional move.
Analysis of the XAUUSD 1-Hour Candlestick Chart
Technical Indicators:
On the 1-hour chart for XAUUSD, the price is currently trading near the upper band of the Bollinger Bands, indicating an overbought short-term condition and heightened volatility. The bands are widening, which typically signals an upcoming increase in price swings. While explicit moving averages, RSI, or MACD lines are not visible on the provided chart, current price action around the band edges and the prevailing uptrend imply that short-term moving averages are above longer-term averages, and momentum remains bullish.
Chart Patterns:
The recent structure suggests the market is experiencing a bullish impulse leg, likely as part of a broader five-wave Elliott Wave sequence. According to complementary analysis, a minor corrective (bearish) wave may be in progress or imminent, with the possibility of further upside movements once this consolidation completes. No clear head and shoulders, double top/bottom, or triangle patterns are present at this time, but the structure generally supports continuation rather than reversal.
Candlestick Patterns:
Within the visible section, recent candlestick behavior shows a series of bullish bodies, with occasional small-bodied or doji-like candles suggesting periodic indecision or pause as the market encounters resistance. No strong reversal patterns such as bearish engulfing, hammer, or shooting star are clearly resolved at major swing points, reinforcing the view that any correction is likely to be minor—provided key supports are not breached.
Trend Assessment:
XAUUSD is in a clear short-term uptrend. The series of higher highs and higher lows, combined with price adherence to the upper Bollinger Band, confirm a bullish structure. However, the overbought status and recent slowing momentum indicate there could be a short-term pullback or sideways consolidation before the next leg higher.
Support and Resistance Levels:
– Immediate resistance is seen near 3,373, which is both a recent price ceiling and an area of active supply.
– Above this, the next major target is the July high at 3,439 if bullish momentum resumes.
– First key support lies at 3,344. Below that, a broader support zone exists between 3,325 and 3,300, which would be pivotal for maintaining the longer-term uptrend.
– A critical near-term support for confirming the uptrend on the 1-hour chart is at 3,314.85; a decisive break below this would signal shifting market structure and potential deeper correction.
Other Technical Insights:
While volume is not displayed, the widening of the Bollinger Bands and the sharpness of the recent price moves suggest that momentum is strong but may be approaching exhaustion as short-term traders take profits. Any significant divergence between price and momentum oscillators (if they were visible) would add to reversal risk, but for now, the trend remains intact.
Actionable Summary:
Gold (XAUUSD) remains firmly in an intraday uptrend, with volatility increasing and prices testing key resistance in the 3,373 region. While short-term overbought conditions and some slowing momentum caution against aggressive new longs at current levels, the bullish structure remains valid above 3,314.85. A corrective pullback toward support at 3,344–3,325 would present potential buying opportunities for trend continuation, with upside targets at 3,373 and 3,439. Only a decisive break below 3,314 would suggest a deeper correction and a reconsideration of the bullish bias. Cautious trade management and close monitoring of price action around these key levels are warranted as gold approaches important technical inflection points.