


 |
| Gold V.1.3.1 signal Telegram Channel (English) |

GBPUSD: Triangle Consolidation Pattern Signals Heightened Short-Term Volatility
2025-11-18 @ 18:33
GBPUSD: Triangle Consolidation Pattern Signals Heightened Short-Term Volatility
Over the past three trading days, GBPUSD has shown increased volatility, closing yesterday at 1.31489, slightly down by 0.03%. Although there were no major news directly impacting GBPUSD this week, the overall market sentiment has been influenced indirectly by global economic data and US economic indicators. The pair is consolidating around the 1.31 level as traders watch a technical triangle consolidation setup that hints at a potential breakout soon. For the average investor, this means a cautious market environment where key support and resistance levels should be closely monitored to navigate potential trading opportunities and manage risk effectively.
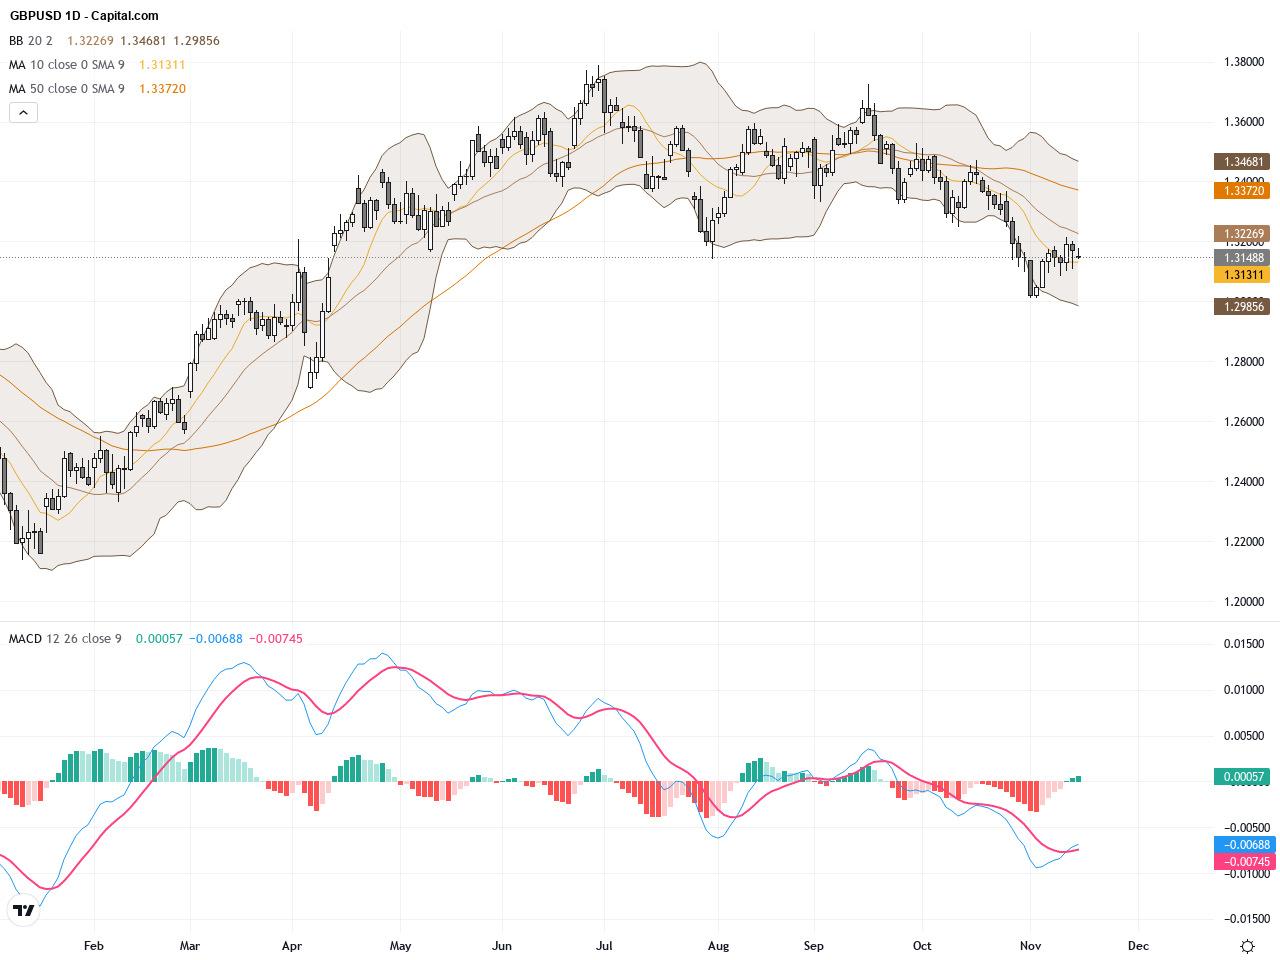
The daily chart of GBPUSD over the last 15 trading days shows a contracting triangle pattern, indicating intense battle between bulls and bears. The narrowing Bollinger Bands suggest declining volatility, while the MACD is near the zero line with signs of a potential bullish crossover. The 50-day and 200-day moving averages at approximately 1.33 and 1.34 respectively remain well above current price, indicating medium to long-term resistance. Overall, the daily price action is consolidating and a breakout in either direction will be crucial for the next leg.

On the hourly chart covering the past 3-5 days, GBPUSD is forming a skewed symmetrical triangle that signals short-term consolidation. Moving averages have been crossing frequently, showing increased short-term volatility, while the MACD highlights strong momentum divergence. A recent bearish engulfing candlestick with a long upper wick suggests added selling pressure for the next 24 hours, with immediate support near 1.3140. A breakdown below this level could accelerate downside momentum.
Technical Trend: GBPUSD is currently in a cautious sideways consolidation phase, characterized by moderate uncertainty and rangebound price action.
Technically, GBPUSD is trapped within a key triangle consolidation pattern. The daily MACD hints at a possible bullish momentum building, but the hourly bearish engulfing signal and volatile moving average crossovers suggest short-term selling pressure. Volume remains subdued, indicating a lack of strong directional conviction. Traders should monitor for a breakout above resistance or break below support to confirm the next directional move.There are no significant economic events directly impacting GBPUSD today. Key US data releases such as factory orders and durable goods orders at 16:00 GMT+1 (23:00 HKT) are expected to have limited deviation from prior readings, indicating a neutral to slightly positive impact for the USD. No major UK economic indicators are scheduled during Hong Kong trading hours today. Hence, GBPUSD is likely to remain technically driven without direct fundamental catalysts in the short term.
Resistance & Support

<
p style=”padding: 10px; margin: 20px 0; border: solid 1px #fa003f; border-radius: 5px;”>The above financial market data, quotes, charts, statistics, exchange rates, news, research, analysis, buy or sell ratings, financial education, and other information are for reference only. Before making any trades based on this information, you should consult independent professional advice to verify pricing data or obtain more detailed market information. 1uptick.com should not be regarded as soliciting any subscriber or visitor to execute any trade. You are solely responsible for all of your own trading decisions.