


 |
| Gold V.1.3.1 signal Telegram Channel (English) |

WTI Crude Oil: Dollar Strength Boost Triggers Price Adjustment and Key Technical Levels
2025-12-09 @ 08:02
Over the past 24 to 48 hours, WTI crude oil prices have experienced notable volatility, closing at $58.86 on December 8th, down from the previous day. The recent price movement was largely influenced by a strengthening U.S. dollar and falling equity markets, which caused a sharp 2% decline that day.
Earlier this week, the firming U.S. dollar put pressure on oil prices as the stronger dollar makes dollar-priced oil more expensive for holders of other currencies, dampening demand. Additionally, the overall weakness in stock markets led to lower risk appetite, reducing the appeal of energy commodities. These factors reversed the oil market’s prior three-day winning streak, triggering a rapid price pullback.
For the average investor, this scenario is akin to when the dollar gains value, raising the cost of buying oil, while a weak stock market cools investor sentiment, pulling prices down. Despite the downturn, speculators have increased their net long positions after recent sharp declines, indicating some market participants anticipate a price rebound. Furthermore, OPEC+’s decision to hold production steady implies potential oversupply pressure, which is a critical backdrop to recent price fluctuations.
In summary, WTI crude oil prices have retraced amid the dual impact of a strong dollar and declining equities, reflecting market concerns over U.S. monetary policy and global economic uncertainties. Investors should closely monitor geopolitical and economic developments that could further influence oil prices.
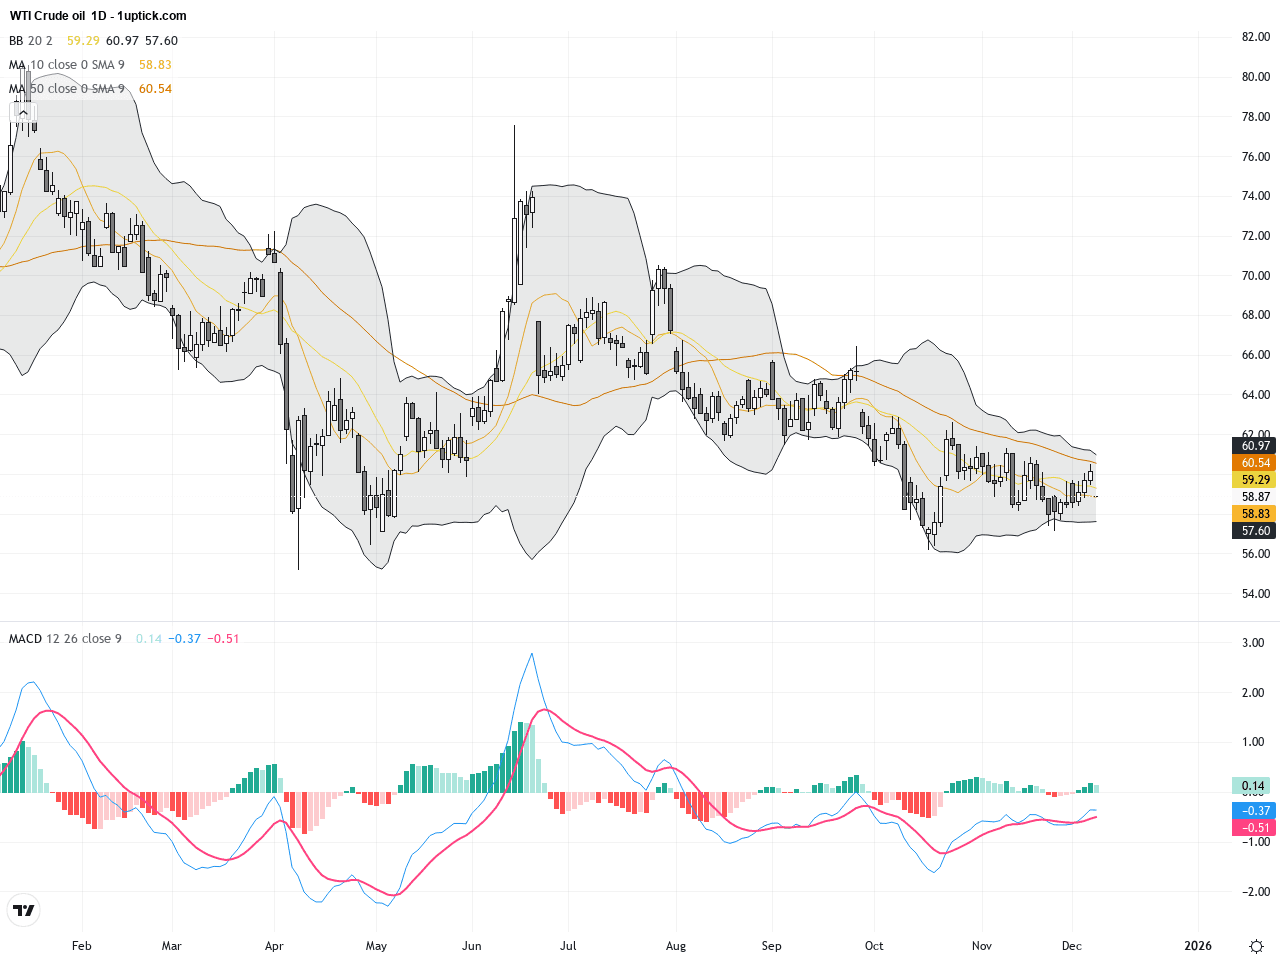
The daily chart of WTI Crude Oil shows price consolidating within a $59-$61 range for the past month, indicating a sideways trend. Moving averages are relatively flat and intertwined, lacking directional clarity. Bollinger Bands are slightly contracting, suggesting reduced volatility as the price approaches a critical decision zone. The MACD hovers near the zero line, highlighting waning momentum that could tip towards a short-term pullback if it breaks lower. Overall, the daily chart suggests the market is awaiting a clear directional breakout.
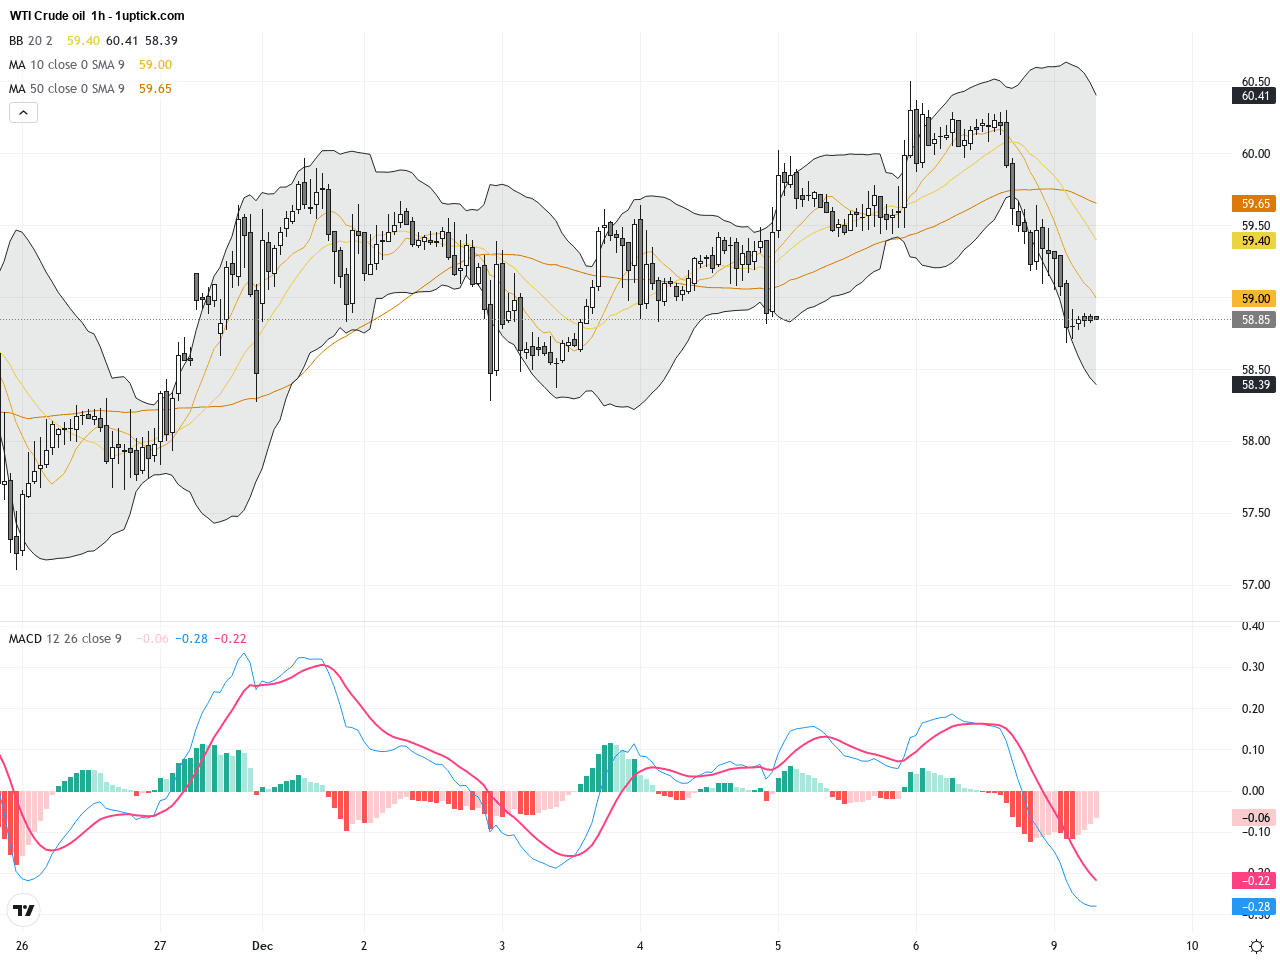
The hourly chart over the last 3-5 days reveals amplified volatility, as WTI retreated sharply from around $60 to $58.5 in response to a stronger US dollar. Short-term moving averages have crossed downward, signaling increased selling pressure. Bollinger Bands have widened to accommodate heightened price swings. The MACD shows a bearish crossover accompanied by expanding negative momentum bars, confirming downward momentum. Notably, several bearish engulfing candlesticks indicate sustained short-term bearish sentiment over the next 24 hours.
Technical Trend: WTI currently exhibits a cautiously bearish consolidation, with choppy price action and no clear directional bias, reflecting a period of sideways movement. Short-term pressures lean negative, but medium to long-term support remains intact.
Technically, WTI appears to be forming a potential head and shoulders pattern dating from early December, which could herald a deeper correction if key support breaks. Recent bearish engulfing candlesticks underscore intensified selling pressure. Momentum indicators like MACD and RSI are trending weaker, signaling caution. Monitoring whether critical support levels hold is essential for anticipating a possible trend reversal or continuation.Today’s economic calendar features no major events directly affecting WTI Crude Oil. Market attention remains on dollar performance and equity market movements, which continue to indirectly influence oil price fluctuations. Traders should watch global macroeconomic updates and geopolitical developments for potential impact.
Resistance & Support

The above financial market data, quotes, charts, statistics, exchange rates, news, research, analysis, buy or sell ratings, financial education, and other information are for reference only. Before making any trades based on this information, you should consult independent professional advice to verify pricing data or obtain more detailed market information. 1uptick.com should not be regarded as soliciting any subscriber or visitor to execute any trade. You are solely responsible for all of your own trading decisions.