


 |
| Gold V.1.3.1 signal Telegram Channel (English) |
GBPUSD Technical Outlook: Key Support and Resistance Levels Amid Mixed Market Signals
2025-12-22 @ 08:01
Over the past 24 to 48 hours, GBP/USD experienced slight downward pressure, closing yesterday at 1.33789, just below the previous close of 1.3372. The market felt the impact of weaker-than-expected UK retail sales data, which unexpectedly contracted and indicated ongoing consumer spending pressures. This fundamental news directly weighed on the pound’s short-term performance.
Moreover, Federal Reserve Bank of Cleveland President Beth Hammack stated that holding interest rates steady is her base case for now, reducing expectations for further US rate hikes. This cautious stance supported the US dollar, limiting the pound’s rebound potential. Following the Bank of England’s surprise rate cut to 3.75%, the pound briefly strengthened but ultimately remained under pressure due to weak UK economic data and the Fed’s cautious tone, with the exchange rate hovering just below the 1.3400 mark.
In summary, the past couple of days have reflected a tug-of-war for the pound amid weakening UK fundamentals, central bank policy shifts, and a relatively cautious US Fed. For the average investor, the GBP/USD market feels like a subtle battle where weaker UK data weighs on the pound while the Fed’s pause supports the dollar, resulting in range-bound fluctuations. Investors should closely monitor upcoming data releases and central bank signals to capture the market’s next direction.

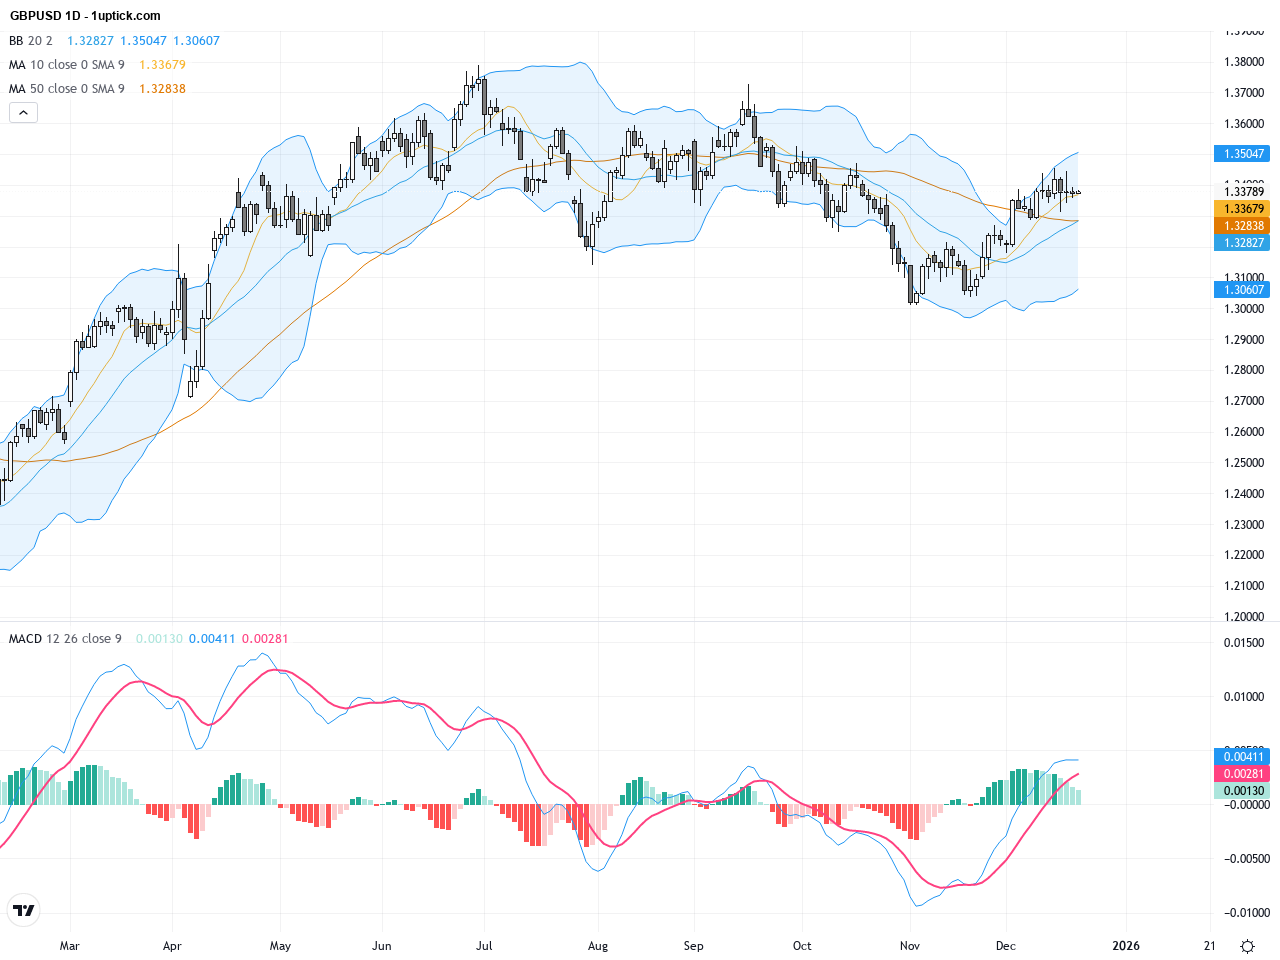
The daily chart reveals GBPUSD in a downward consolidation trend, pulling back from a yearly high of 1.37886 to around yesterday’s close near 1.3379. The price recently crossed below the 200-day moving average (~1.3405), signaling fading bullish momentum. Bollinger Bands have contracted, indicating decreasing volatility, while the MACD remains bearish. Overall, the trend favors a weak consolidation until a breakout signal emerges.
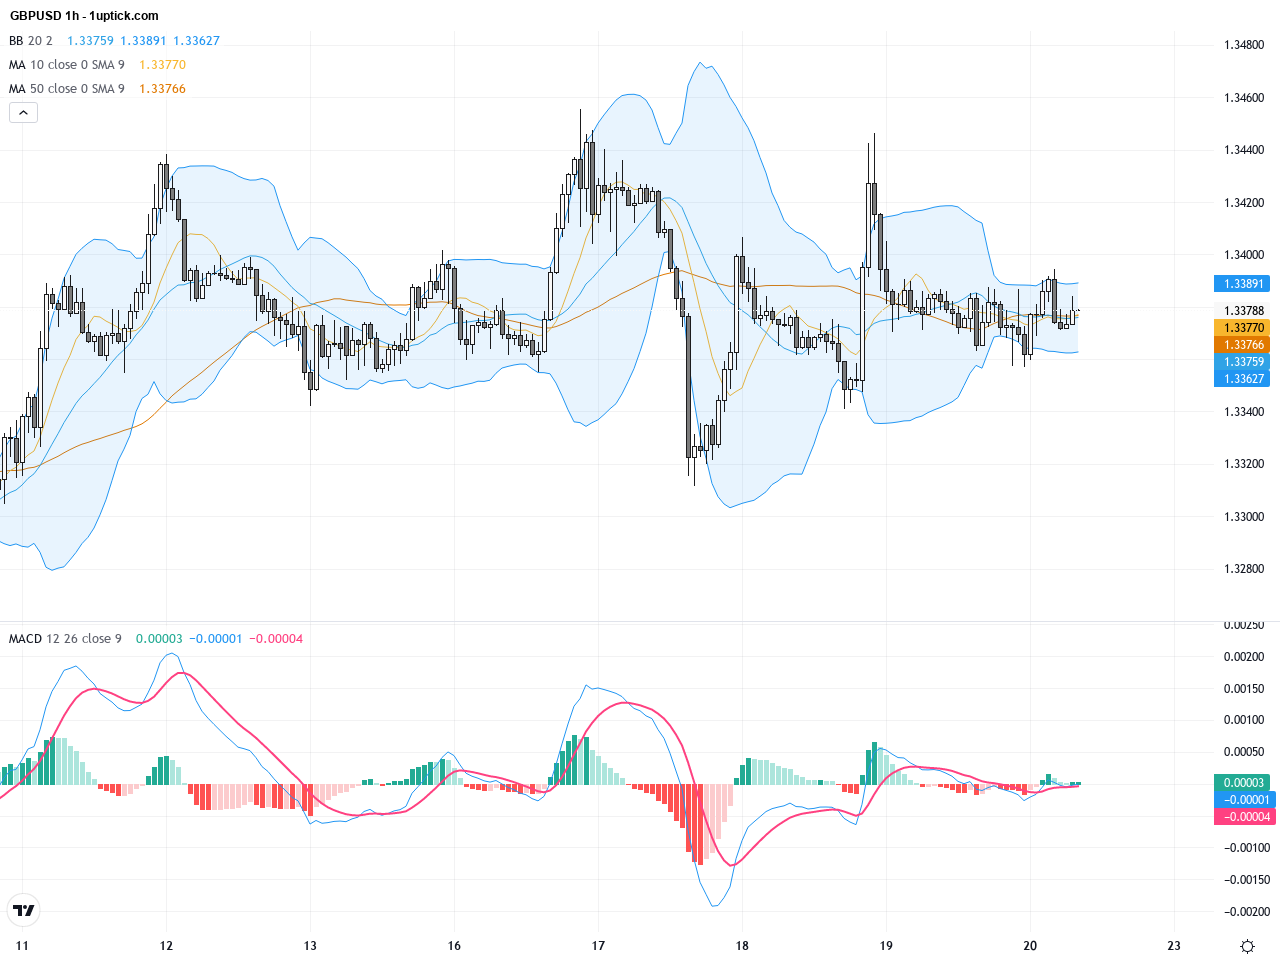
On the hourly timeframe, GBPUSD has been oscillating between 1.3370 and 1.3400 over the past five days. Short-term moving averages (20 and 50 EMA) are intertwined, showing indecision among traders. A slight bearish MACD crossover is visible but lacks strong momentum. The narrowing Bollinger Bands suggest an imminent breakout. Watch for holds or breaks above 1.3400 resistance and 1.3350 support for trading opportunities.
Technical Trend: Cautiously bearish: GBPUSD is consolidating within range but shows a slight bearish bias in the short term.
Technically, GBPUSD is forming a short-term triangle consolidation pattern since mid-December between 1.3350 and 1.3400. The daily MACD remains in negative territory and accelerating downward, hinting at a potential momentum surge post-consolidation. A recent bearish engulfing candlestick pattern strengthens the bearish sentiment for the near term. GBPUSD stands at a pivotal juncture, and the breakout direction will set the tone for coming sessions.Today’s economic calendar highlights key UK releases at 08:00 GMT+1, including the current account and final GDP figures for Q3. Expectations are for a slowdown in UK’s GDP growth to 0.1% q/q and a narrower current account deficit at -21.5 billion GBP. These data points will be critical catalysts for GBPUSD price action. From the Hong Kong perspective (HKT 2025-12-22 08:00), the releases are pending; traders should monitor closely for market-moving impacts.
Resistance & Support

The above financial market data, quotes, charts, statistics, exchange rates, news, research, analysis, buy or sell ratings, financial education, and other information are for reference only. Before making any trades based on this information, you should consult independent professional advice to verify pricing data or obtain more detailed market information. 1uptick.com should not be regarded as soliciting any subscriber or visitor to execute any trade. You are solely responsible for all of your own trading decisions.