


 |
| Gold V.1.3.1 signal Telegram Channel (English) |

USDCAD: Key Resistance at 1.3800 Challenges Recent Rally in Trading Outlook
2026-01-05 @ 18:35
Over the past 24 to 48 hours, the USD/CAD pair has shown a steady recovery, rebounding from a five-month low of 1.3640 on December 26 to close yesterday at 1.37759, marking an increase of over 0.35%. Multiple news reports highlight that the recent strength of the US dollar against the Canadian dollar is driven by escalating geopolitical tensions and stronger-than-expected US labor market data, both of which have supported the dollar’s uptrend.
Recent Canadian manufacturing data showed contraction, weakening the Canadian dollar and pushing USD/CAD higher to around 1.3750 during Asian trading hours. While demand for the dollar remains firm overall, analysts note that USD/CAD may struggle to break above the 1.3800 level, indicating potential resistance ahead.
For average investors, the strengthening dollar means the cost of investments denominated in Canadian dollars might increase in the near term. Forex traders should be aware that the USD/CAD pair could face heightened volatility due to mixed signals, with the durability of the recent rebound dependent on upcoming Canadian economic data and evolving geopolitical developments.

The daily chart shows USDCAD rebounding steadily from the late December low of 1.3640, breaking above the 50-day moving average but still trading just below the 200-day moving average at 1.38279. Bollinger Bands display the price nearing the upper band but tightening range suggests rising resistance. The MACD remains above zero indicating an overall bullish bias, though the histogram shows reduced momentum hinting at possible consolidation. The trend appears cautiously bullish, awaiting a clear breakout above the key 1.3800 resistance level.
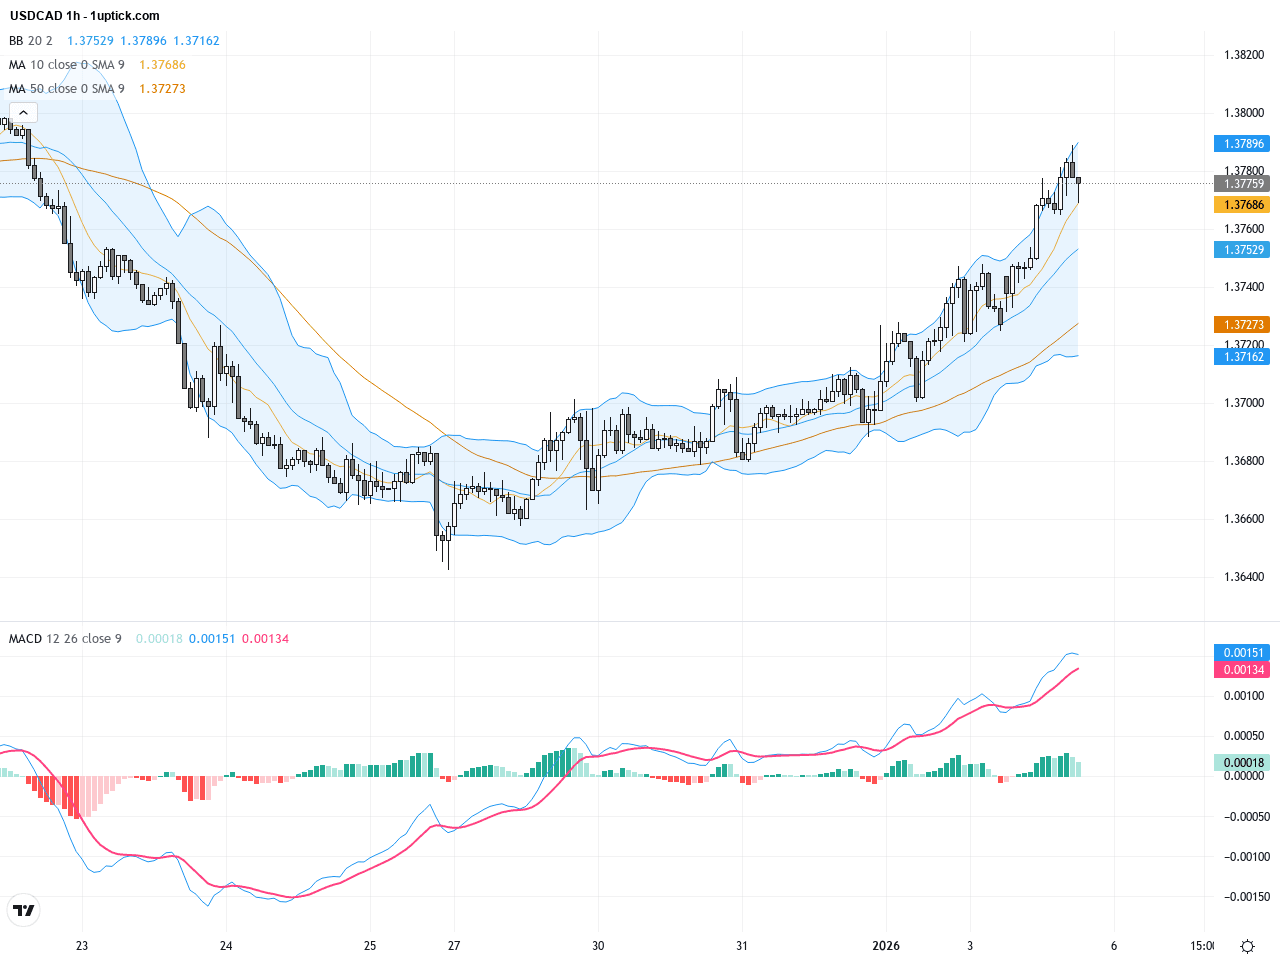
Over the past 3-5 days on the hourly chart, USDCAD exhibits increased short-term volatility. Short-term moving averages have crossed upward, reflecting active buying pressure. A significant bullish engulfing candlestick recently appeared, signaling optimistic momentum over the next 24 hours. Bollinger Bands have contracted, often a precursor to a volatility breakout. The MACD has formed a golden cross, supporting the momentum for an upward move, although traders should remain vigilant for potential pullbacks near resistance.
Technical Trend: USDCAD is currently in a ‘Cautiously Bullish’ short-term trend, facing key resistance levels that may prompt volatility and retracement.
Technically, the daily MACD shows momentum has softened but not reversed, while the hourly chart displays a bullish golden cross, an encouraging sign for short-term buyers. The recent bullish engulfing candlestick confirms upside bias in the near term. However, resistance near the Bollinger Bands upper band and the 200-day moving average at 1.3828 presents a challenge. Traders should closely watch price reactions around the 1.3800 mark to gauge the direction and potential continuation of the rally.Today’s economic calendar highlights the US ISM Manufacturing Index and related subindices at 16:00 GMT+1 as the most relevant event for USDCAD. Expectations are slightly above the previous figures; a stronger than anticipated report could boost the US dollar, potentially pushing USDCAD higher. Early Asian session PMI data from Japan and China have limited direct impact but influence overall market sentiment. No other significant direct Canadian economic releases are scheduled today, emphasizing the importance of the US data’s immediate market reaction.
Resistance & Support

The above financial market data, quotes, charts, statistics, exchange rates, news, research, analysis, buy or sell ratings, financial education, and other information are for reference only. Before making any trades based on this information, you should consult independent professional advice to verify pricing data or obtain more detailed market information. 1uptick.com should not be regarded as soliciting any subscriber or visitor to execute any trade. You are solely responsible for all of your own trading decisions.