


 |
| Gold V.1.3.1 signal Telegram Channel (English) |

USDJPY: Key Resistance Test Near 156.80 Amid Japan PMI-Induced Yen Weakness
2026-01-07 @ 11:02
Over the past 24 to 48 hours, the USD/JPY has fluctuated notably between 156.50 and 157.00, closing yesterday at 156.644, with market sentiment swinging amid US and Japanese economic data releases. The latest Japanese Services PMI pointed to inflationary pressure, coupled with hawkish rhetoric from the Bank of Japan (BoJ), which weighed on the yen and bolstered the US dollar.
This price action reflects a reassessment by investors regarding the BoJ’s stance on rate hikes, combined with changes in US economic data and shifts in risk sentiment, driving USD/JPY to rally initially then dip. Specifically, BoJ Governor Kazuo Ueda’s indication that interest rates may continue rising has suppressed the yen, while markets are also factoring in US Treasury yield movements and heightened geopolitical risks, boosting haven demand.
For the average investor, this means the forex market is currently influenced by multiple intersecting factors, resulting in increased volatility for the USD/JPY pair. Staying attuned to upcoming BoJ rate decisions and US economic updates will be crucial for anticipating the pair’s future direction.
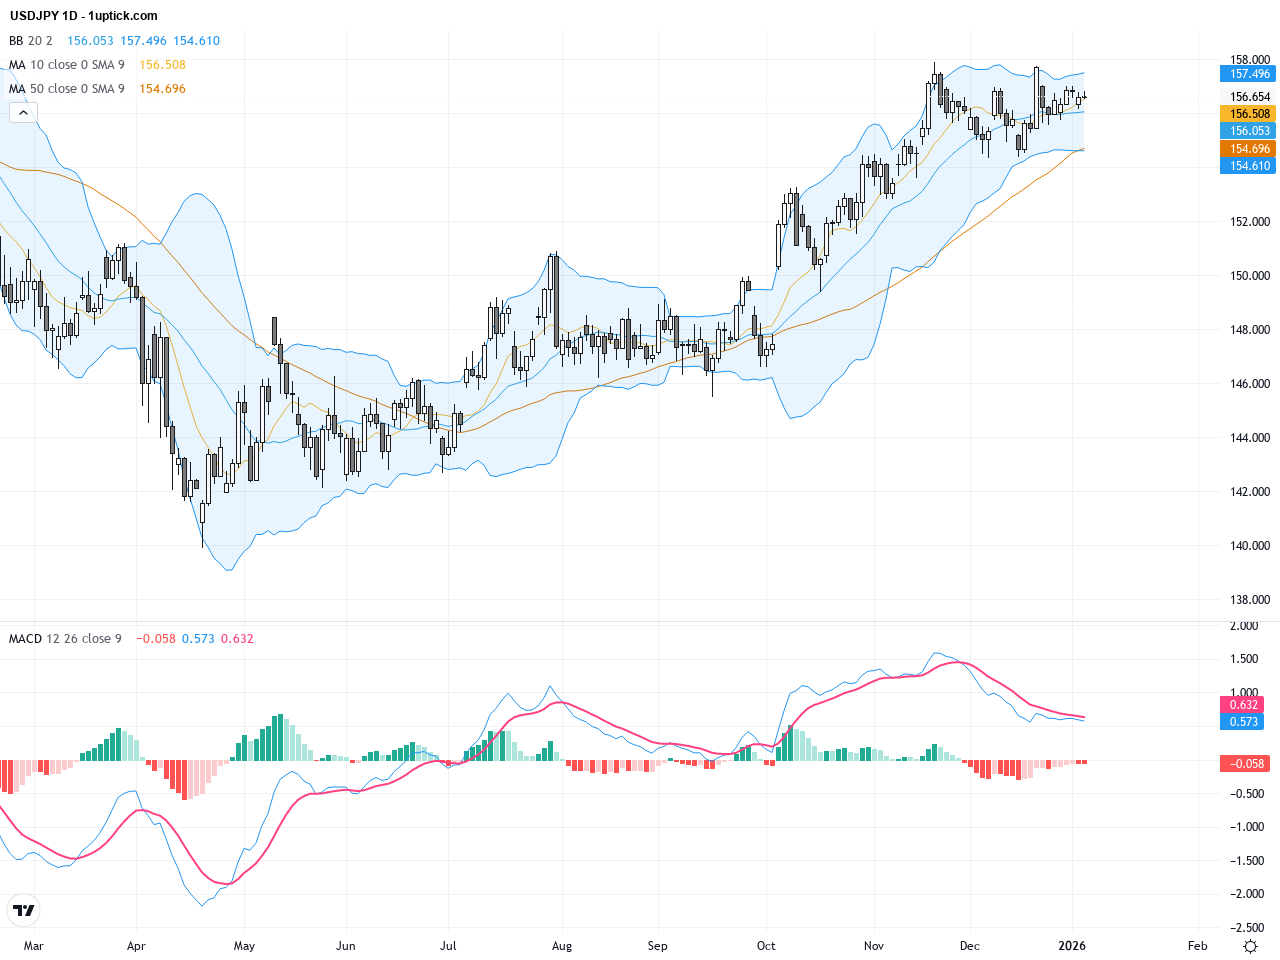
The USDJPY daily chart shows a clear uptrend with prices trading above the 200-day moving average since recent lows. The 50-day moving average is above the 200-day, confirming bullish momentum. Bollinger Bands are expanding, indicating increased volatility. The MACD remains positive but is converging, suggesting a potential slowing in momentum. Overall, the technical framework supports a medium to long-term uptrend, but the key resistance near 156.80 might limit short-term gains.
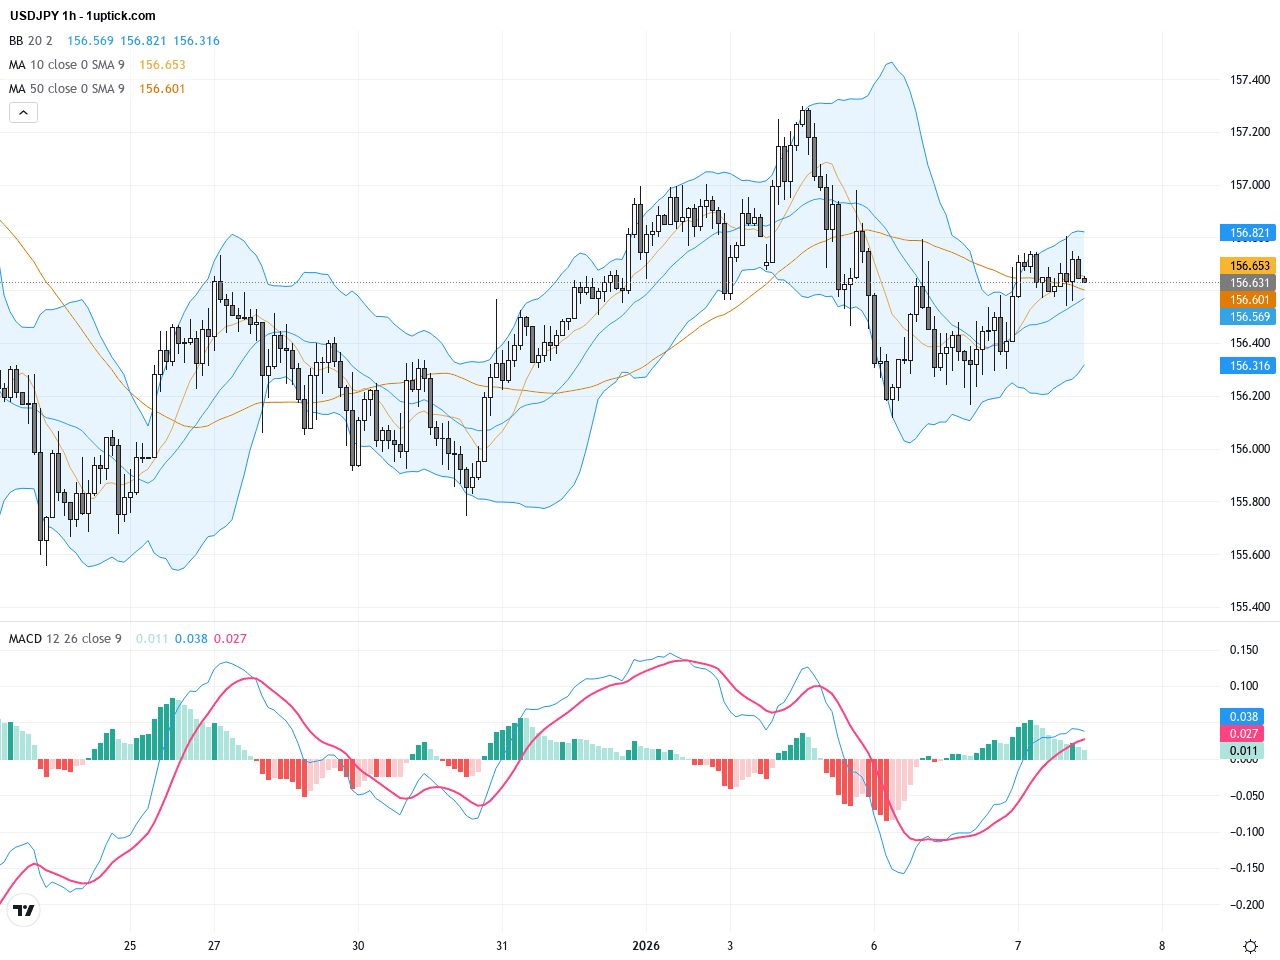
On the hourly chart, USDJPY has traded in a range between 156.20 and 157.20 over the past 3 to 5 days. Short-term moving averages like the 5EMA and 20SMA are intertwined, reflecting consolidation. The MACD shows a battle between bulls and bears, and the narrowing Bollinger Bands imply an imminent breakout. A recent bearish engulfing candlestick warns of short-term downside risk, though confirmation from further economic data is needed.
Technical Trend: Cautiously upward consolidation
Technically, USDJPY remains in a medium-term uptrend but faces immediate resistance around 156.80. The bearish engulfing candlestick pattern indicates possible short-term pullback. The MACD momentum, while still bullish, is weakening, signaling potential consolidation ahead. Traders should watch for a breakout from the current trading range and use fundamental cues from BOJ and US data for confirmation of trend continuation or reversal.Today’s European CPI and retail sales data, although relevant to broader market sentiment, do not directly impact USDJPY. However, market participants should watch for comments from FOMC member Bowman at 22:10 HKT, which could significantly influence USD sentiment and subsequently USDJPY price action. No major direct economic releases related to USDJPY are scheduled today, but the Federal Reserve speech might cause volatility.
Resistance & Support

The above financial market data, quotes, charts, statistics, exchange rates, news, research, analysis, buy or sell ratings, financial education, and other information are for reference only. Before making any trades based on this information, you should consult independent professional advice to verify pricing data or obtain more detailed market information. 1uptick.com should not be regarded as soliciting any subscriber or visitor to execute any trade. You are solely responsible for all of your own trading decisions.