


 |
| Gold V.1.3.1 signal Telegram Channel (English) |

XAUUSD Gold Price Faces $6.8B Futures Rebalancing Pressure Amid Technical Pullback
2026-01-09 @ 05:01
Over the past 48 hours, Gold (XAUUSD) has experienced notable price fluctuations, closing yesterday (January 8, 2026) at $4,464.92, slightly higher than the previous day. The market has continued to show strength in gold at the start of 2026 but is facing some short-term pullback pressure mainly due to a stronger U.S. dollar and commodity index rebalancing. Gold prices declined for a third consecutive session under these pressures, presenting a challenge for investors.
Additionally, a significant $6.8 billion futures liquidation event is underway from January 9 to 15, which is expected to add downward pressure on gold prices in the near term. Despite this, gold has remained resilient in early 2026, supported by geopolitical tensions and safe-haven demand. Notably, trading volume on Bitget TradFi for gold surged dramatically, breaking the $2 billion daily volume milestone, highlighting sustained strong market interest and active participation in gold trading.
For the average investor, this means that while gold may experience short-term selling pressure due to index rebalancing and a stronger dollar, its medium to long-term outlook is backed by ongoing geopolitical risks and safe-haven appeal. Investors should closely monitor upcoming futures liquidations and dollar trends to navigate potential volatility and manage risk effectively in their gold investments.
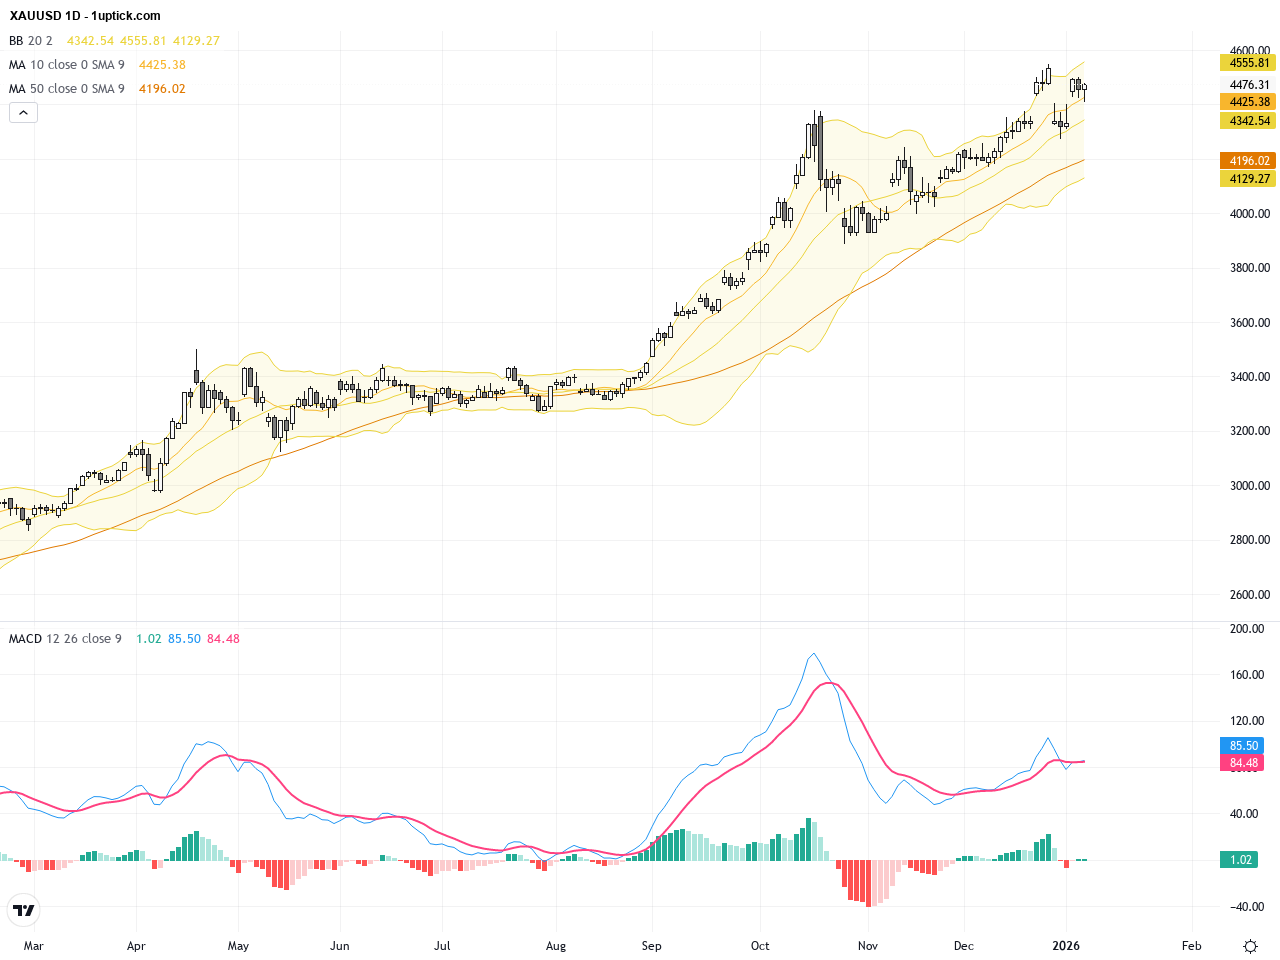
The daily chart shows a strong uptrend from late 2025 into early 2026, peaking near $4,550 before beginning a retracement. The RSI and MACD still favor the bulls, but momentum is weakening. Bollinger Bands indicate price retreating from the upper band, suggesting a short-term correction within a longer bullish trend. Watch for key support zones holding to maintain upward bias.

The last 3-5 days on the hourly chart reveal a clear short-term downtrend with bearish momentum increasing. MACD divergence signals weakness, and the middle Bollinger Band is acting as resistance. A minor head and shoulders pattern has formed recently, hinting at possible more downside. The increased trading volume confirms active market interest but advises caution for quick reversals.
Technical Trend: The current trend is cautiously consolidating, with short-term bearish volatility contained within a medium-term bullish structure.
Technically, XAUUSD shows short-term selling pressure with a MACD bearish crossover and RSI approaching oversold levels, suggesting possible continuation of the pullback. On the daily timeframe, price remains above key moving averages indicating the bullish trend is intact. Surge in volume highlights elevated market focus, potentially leading to high probability trading opportunities around $4,450 support and $4,500 resistance.Today’s GMT+1 economic calendar shows no major direct impact events for XAUUSD. However, major US data releases at 14:30 including Non-Farm Productivity, Unit Labor Costs, and Trade Balance can influence the USD. Strong US data would likely strengthen the dollar and pressure gold prices lower, while weaker data could provide relief rally for gold. Traders should remain alert to these releases.
Resistance & Support

The above financial market data, quotes, charts, statistics, exchange rates, news, research, analysis, buy or sell ratings, financial education, and other information are for reference only. Before making any trades based on this information, you should consult independent professional advice to verify pricing data or obtain more detailed market information. 1uptick.com should not be regarded as soliciting any subscriber or visitor to execute any trade. You are solely responsible for all of your own trading decisions.