


 |
| Gold V.1.3.1 signal Telegram Channel (English) |

USDJPY: Strong Uptrend Confirmed with Key Support and Resistance Levels
2026-01-12 @ 11:01
Over the past 24 to 48 hours, the USD/JPY currency pair has shown notable volatility, trading just above the 158.00 level and closing at 158.034 yesterday. The market has been influenced by several factors, notably the U.S. Department of Justice issuing grand jury subpoenas related to the Federal Reserve, shifting investor focus from procedural matters to concerns over the Fed’s independence, which has pressured the dollar.
Additionally, political developments in Japan, with Takaichi considering a snap election, have caused the Japanese yen to weaken as investors grow cautious about the future direction of Japan’s monetary policy. Although the USD/JPY briefly rose to around 158.05, the upward momentum was limited as the market awaits key U.S. nonfarm payroll data to gauge future trends. Fundamentally, uncertainty in policy and central bank rate differentials between the U.S. and Japan have shaped recent USD/JPY movement, presenting both short-term volatility and risks for investors.
For the average investor, this can be understood as a tug-of-war between divergent monetary policies and political uncertainties in the two countries, making the dollar less uniformly strong and the yen weaker. It’s like two teams vying for dominance around the 158 mark, driving the exchange rate movements seen recently.
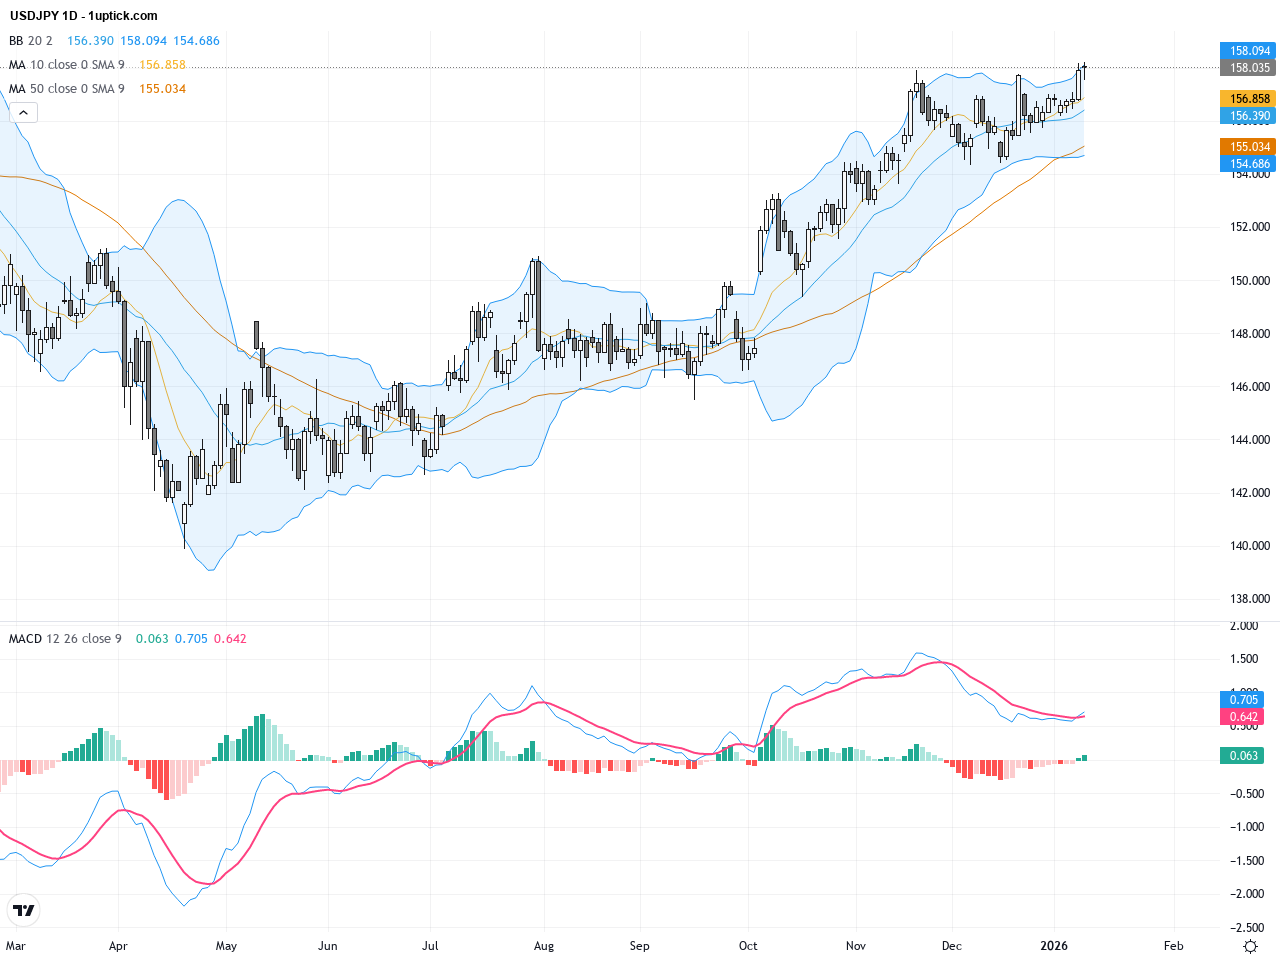
The USDJPY daily chart shows a continuous upward trend since the start of the year, with price breaking above key moving averages (50-day and 200-day MA), confirming a bullish market. The Bollinger Bands have expanded indicating increased volatility, with price oscillating near the upper band suggesting strong buying pressure but potential short-term pullback risk. MACD is positively aligned supporting the upward momentum, indicating a clear bullish bias overall.
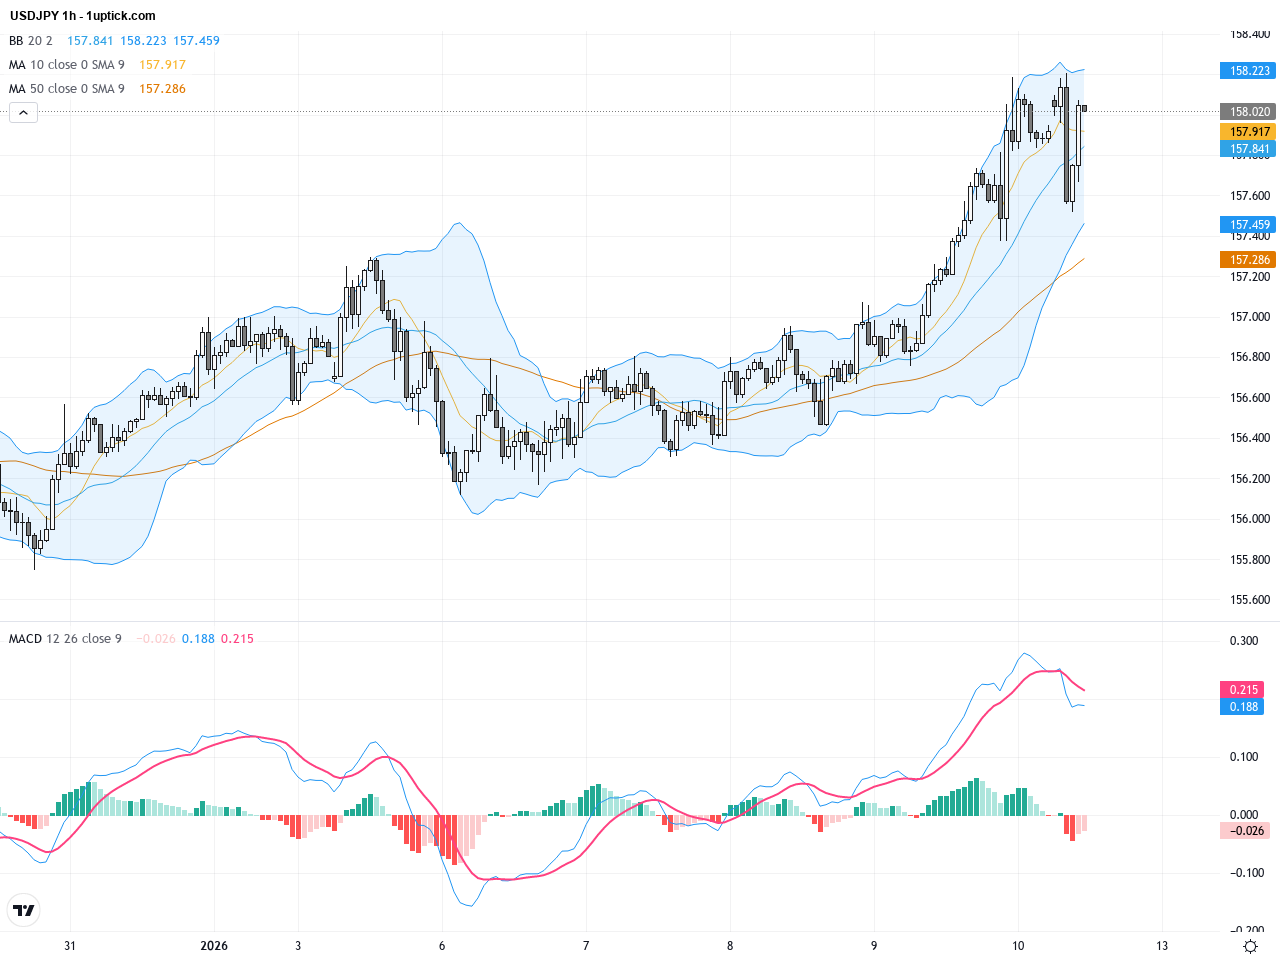
The hourly chart over the past five days reveals short-term price consolidation around the 158 level. Moving averages are arranged bullishly, but the MACD shows some weakening momentum, suggesting a short-term pause. Bollinger Bands are narrowing, highlighting a sideways phase, awaiting critical economic data for directional cues. A triangle consolidation pattern has recently formed; the breakout from this pattern will likely determine the direction for the coming days.
Technical Trend: USDJPY is currently in a decisively bullish trend with short-term volatility and consolidation.
Technically, the daily chart shows a strong breakout and sustained bullish momentum. The hourly chart highlights short-term momentum slowdown and consolidation. Key technical signals include a bullish MACD on the daily chart and a triangle consolidation on the hourly chart awaiting breakout. The recent notable candlestick pattern is a bullish engulfing which suggests potential bullish continuation over the next 24 hours. Traders should watch the key support and resistance levels closely for breakout opportunities.Today’s economic calendar in GMT+1 includes no direct significant data affecting USDJPY, but speeches by two FOMC members at 18:30 and 18:45 are notable as they may provide clues on future Fed policies impacting the dollar’s strength. Overall, the economic events are relatively light today, with USDJPY price movements likely more influenced by political developments and market sentiment than fundamental releases.
Resistance & Support

The above financial market data, quotes, charts, statistics, exchange rates, news, research, analysis, buy or sell ratings, financial education, and other information are for reference only. Before making any trades based on this information, you should consult independent professional advice to verify pricing data or obtain more detailed market information. 1uptick.com should not be regarded as soliciting any subscriber or visitor to execute any trade. You are solely responsible for all of your own trading decisions.