


 |
| Gold V.1.3.1 signal Telegram Channel (English) |
USDJPY: Breakout Above 52-Week High Signals Bullish Momentum Amid US Job Data
2026-01-16 @ 11:01
Over the past 24 to 48 hours, USD/JPY exhibited notable volatility, with the pair climbing slightly from yesterday’s close of 158.29 to around 158.65, reflecting a strong dollar response. This move was primarily driven by better-than-expected US initial jobless claims data, boosting confidence in the US dollar and pushing the pair close to a 52-week high.
Meanwhile, the market kept a close watch on developments in Iran, causing Asian currencies to consolidate as investors adopted a cautious stance pending clearer direction. Additionally, Japanese authorities issued warnings over the weak yen, indicating potential intervention risks that capped the pair’s upside. Yet, hedge funds and market players largely bet on further yen depreciation, eyeing levels near 165, signaling sustained dollar strength.
For the average investor, this price action reflects a scenario where the dollar is gaining momentum fueled by strong US economic data, while the yen is under pressure due to official warnings and intervention concerns. The USD/JPY continues to oscillate between the backdrop of hawkish US economic sentiment and cautious Japanese policy stance. Overall, the pair maintains a bullish tone, but investors should stay alert to policy changes and geopolitical developments impacting the forex market.

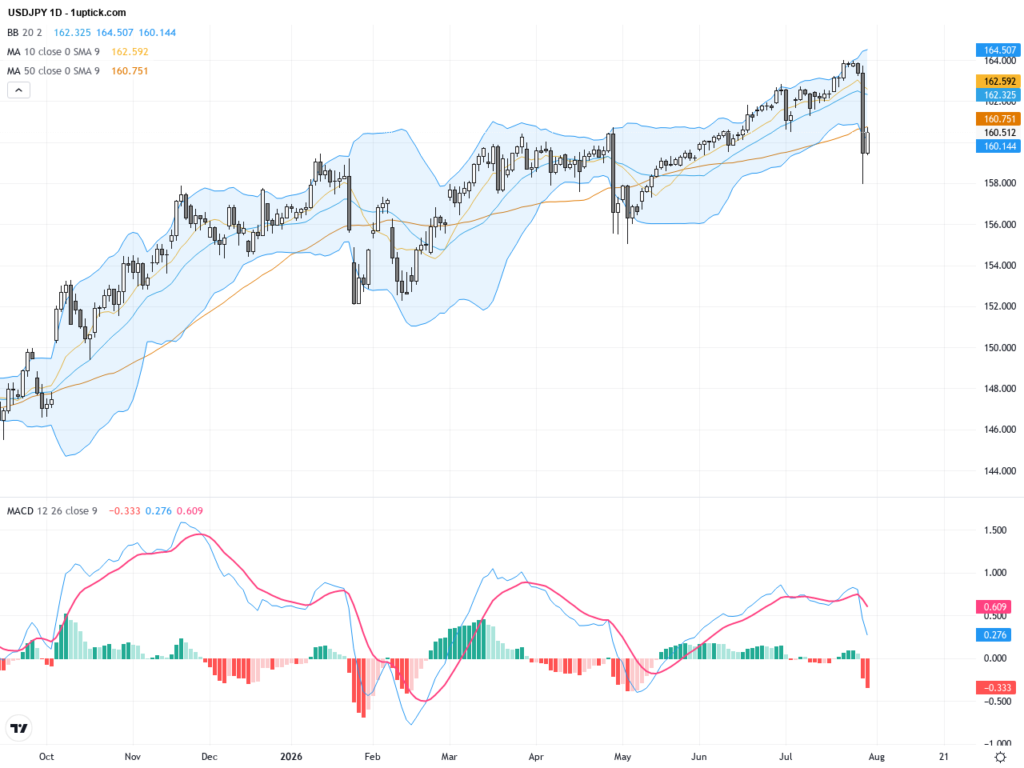
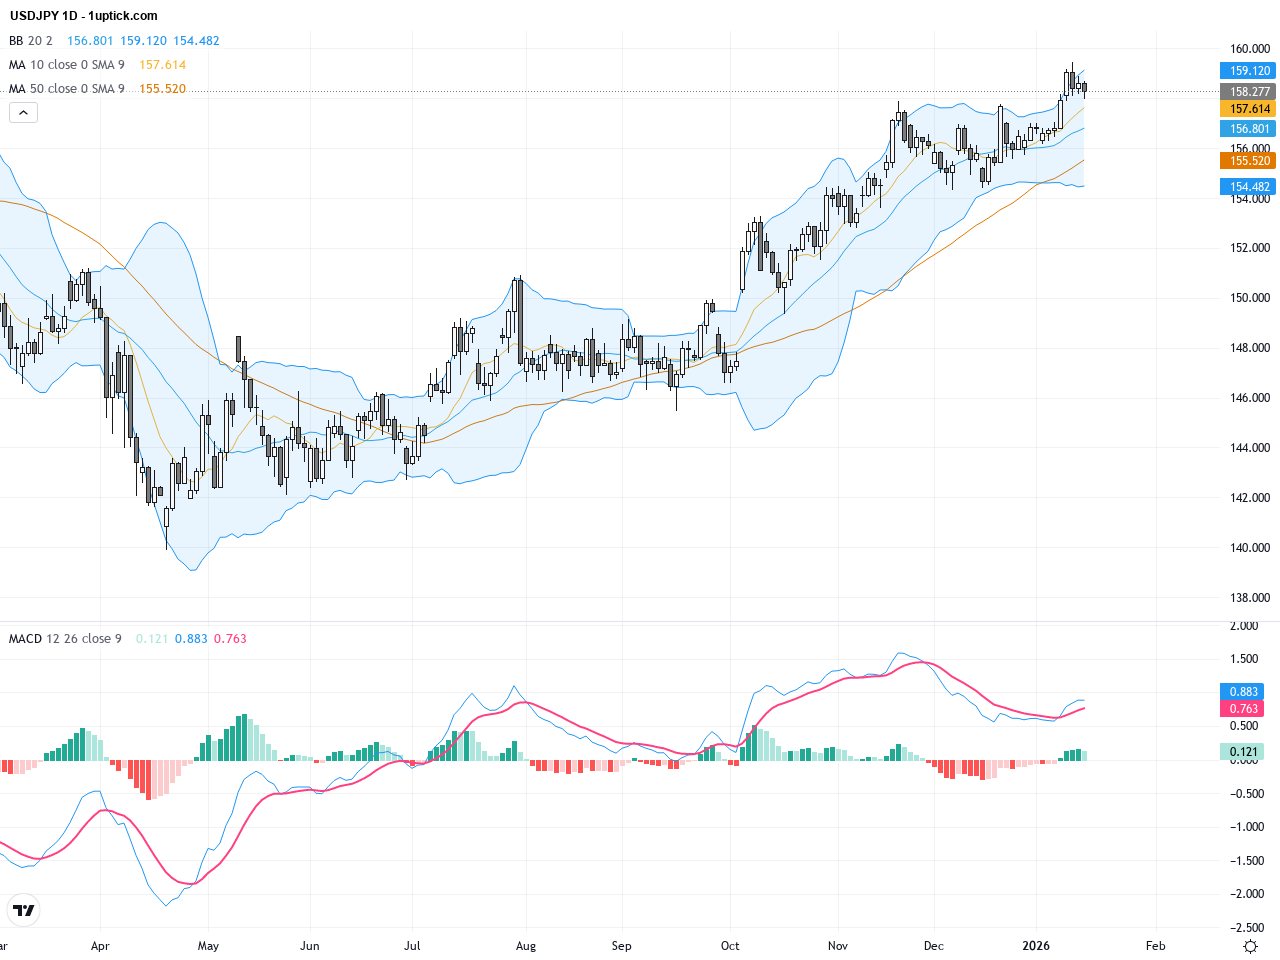
The daily chart reveals a clear strong uptrend with USDJPY price trading well above both 50-day and 200-day moving averages, indicating sustained bullish momentum. Recently, the pair broke through the 159 resistance level, forming a fresh 52-week high. Bollinger Bands are widening upwards, suggesting increased volatility and momentum, while the MACD histogram confirms bullish strength. However, the pair is approaching overbought territory, hinting at possible short-term consolidation or pullback before continuing higher.
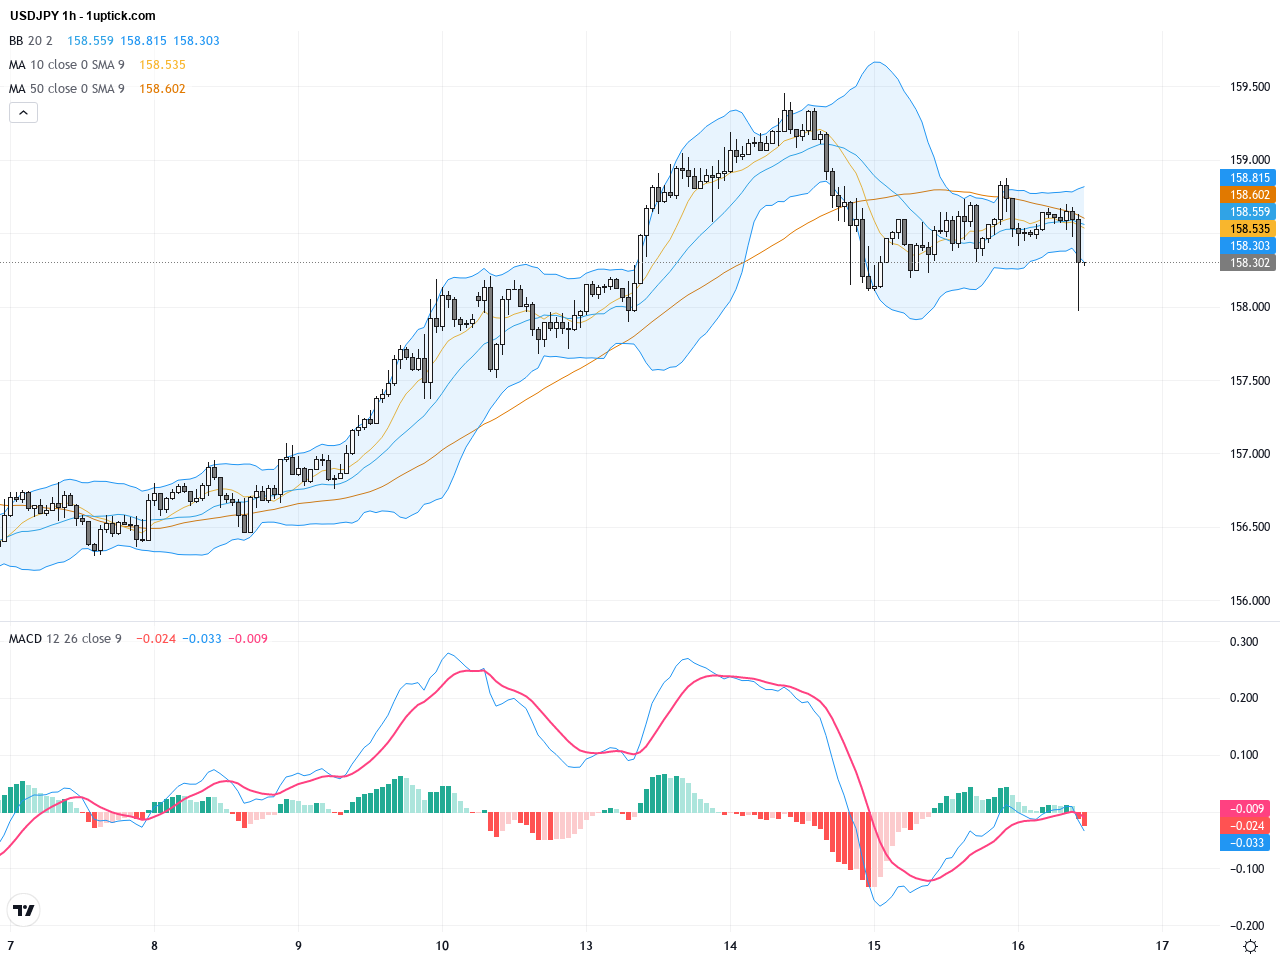
The hourly chart over the last 3-5 days shows USDJPY testing the 158.5-159 range multiple times, encountering resistance and minor retracements. Short-term moving averages show bullish crossovers, supported by increasing MACD momentum bars. Bollinger Bands expansion suggests heightened volatility, signaling that the pair may continue its uptrend but with intermittent pullbacks. Traders should watch for consolidation or breakout above 159.3 to confirm the next directional move.
Technical Trend: Decisively bullish trend with steady upward momentum and potential for continuation upon resistance break.
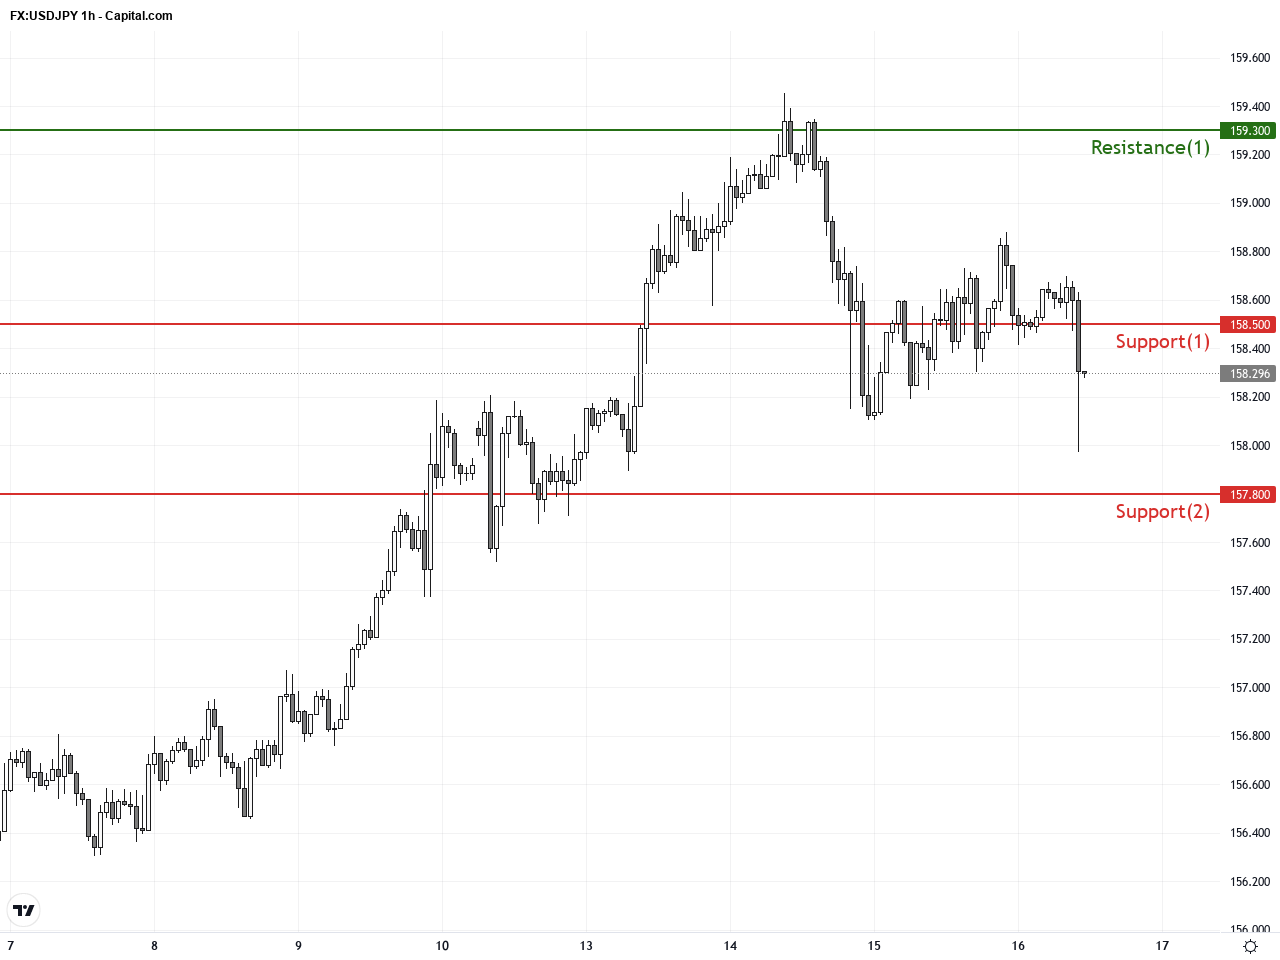
Technically, USDJPY is in a robust bullish phase with daily MACD and moving averages confirming upward momentum. The 52-week high breakout signals a fundamental shift favoring the USD over JPY. However, the hourly chart’s minor pullbacks and consolidation near resistance levels require monitoring. Key technical insight is to watch the 159.3 resistance for a decisive break; successful retest turning into support would present a strong trade opportunity for bulls aiming for targets near 160 and beyond.Today’s economic calendar features key CPI releases from Germany and Italy, alongside Bank of England Chair Bailey’s speech. However, these events have limited direct impact on USDJPY. US data releases include Industrial Production and Capacity Utilization later in the afternoon (GMT+1), but are unlikely to deviate significantly from expectations, resulting in minimal near-term volatility for USDJPY. Traders should instead focus on ongoing geopolitical developments and statements from Japanese officials regarding currency interventions.
Resistance & Support
The above financial market data, quotes, charts, statistics, exchange rates, news, research, analysis, buy or sell ratings, financial education, and other information are for reference only. Before making any trades based on this information, you should consult independent professional advice to verify pricing data or obtain more detailed market information. 1uptick.com should not be regarded as soliciting any subscriber or visitor to execute any trade. You are solely responsible for all of your own trading decisions.