


 |
| Gold V.1.3.1 signal Telegram Channel (English) |

WTI Crude Oil: $58.3 Support Sparks Rebound Amid Eased Iran Tensions with Key Technical Patterns Emerging
2026-01-20 @ 06:01
Over the past 24 to 48 hours, WTI crude oil prices have shown notable volatility. Starting from the closing price of $59.43 on January 19, the market experienced a dip to around $59.06 as geopolitical tensions, particularly those involving Iran, eased. Prices briefly slid to the $58.3 support level, where traders are closely watching for signs of a potential rebound.
Recent market news highlights that although geopolitical risks have cooled, supply concerns remain, compounded by tariff disputes between the US and Europe affecting the energy sector. Meanwhile, speculative traders have slightly increased their net long positions in crude futures, suggesting the possibility of a surprise bounce from the support zone. Overall, WTI is oscillating near $59, reflecting a market still reassessing the impact of fading geopolitical risk premiums on price levels.
For the average investor, the recent WTI fluctuations illustrate the direct influence of global geopolitical and economic developments on energy prices. It’s akin to the market having gone through a sentiment recalibration—from heightened tension to cautious optimism—while underlying supply uncertainty and tariff risks continue to loom as potential disruptors, limiting significant price breakthroughs.
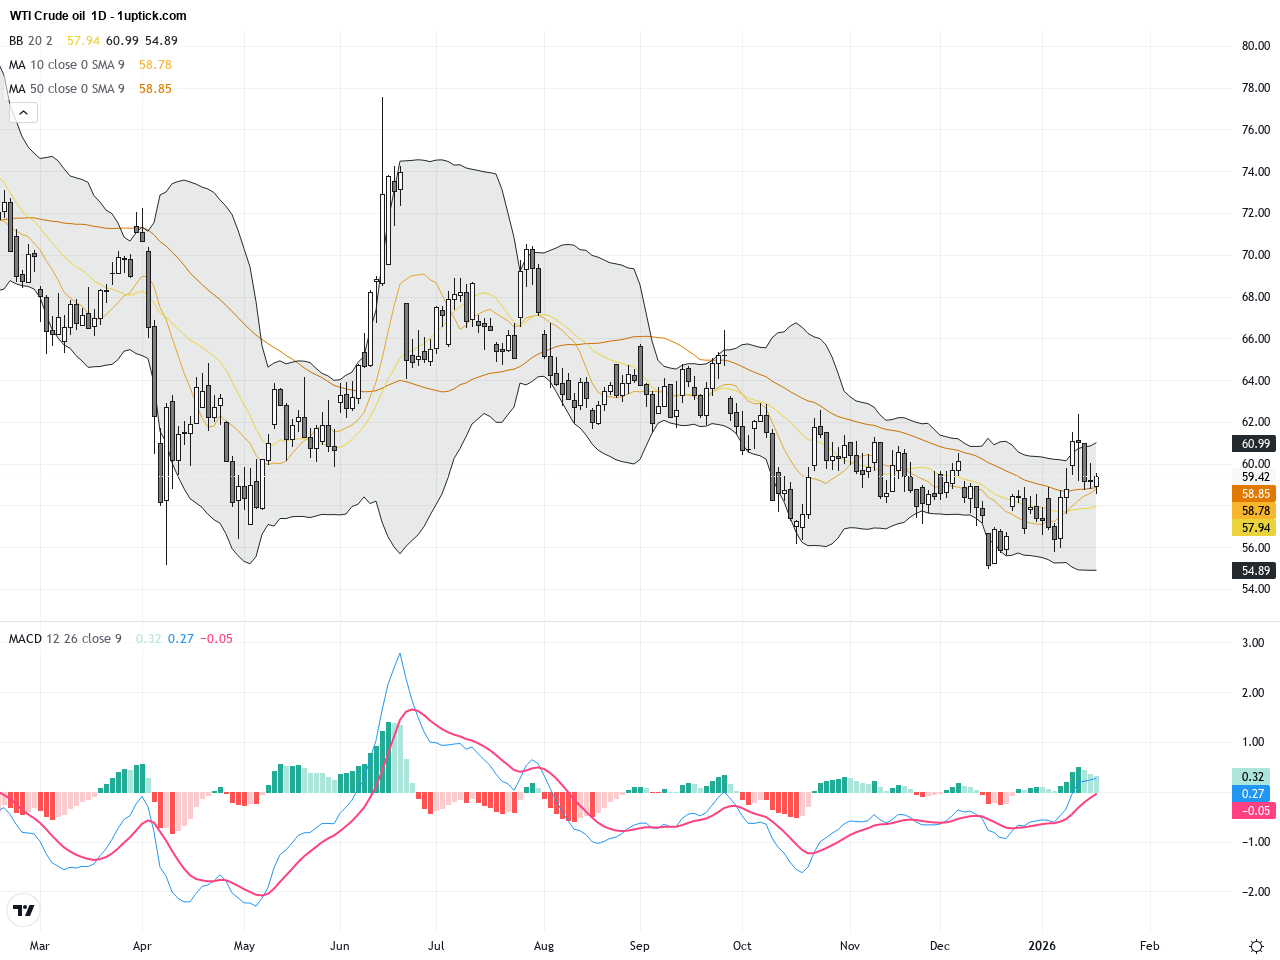
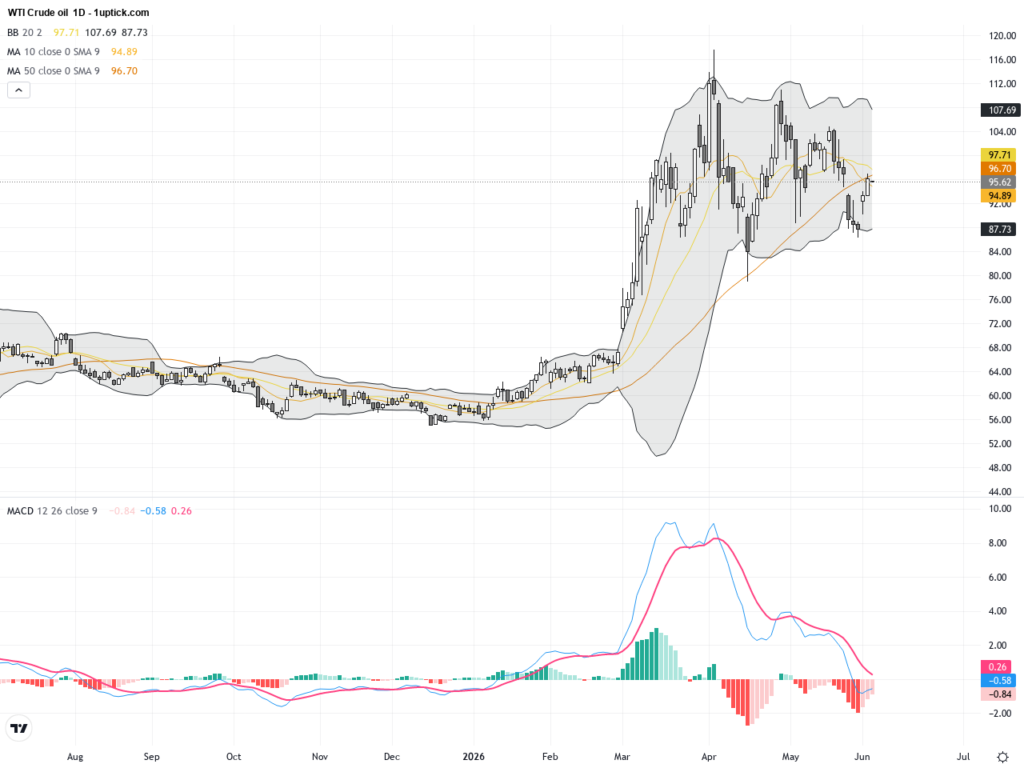
The daily chart for WTI Crude Oil shows a recent phase of consolidation after an extended uptrend. The Bollinger Bands are contracting, indicating reduced volatility, with prices hovering near the middle moving averages, reflecting a balance between bulls and bears. The MACD is flat near the zero line, signaling a lack of decisive trend direction. Overall, the daily trend is neutral, with key levels at $58.3 support and $60 resistance to watch for potential breakout or breakdown.
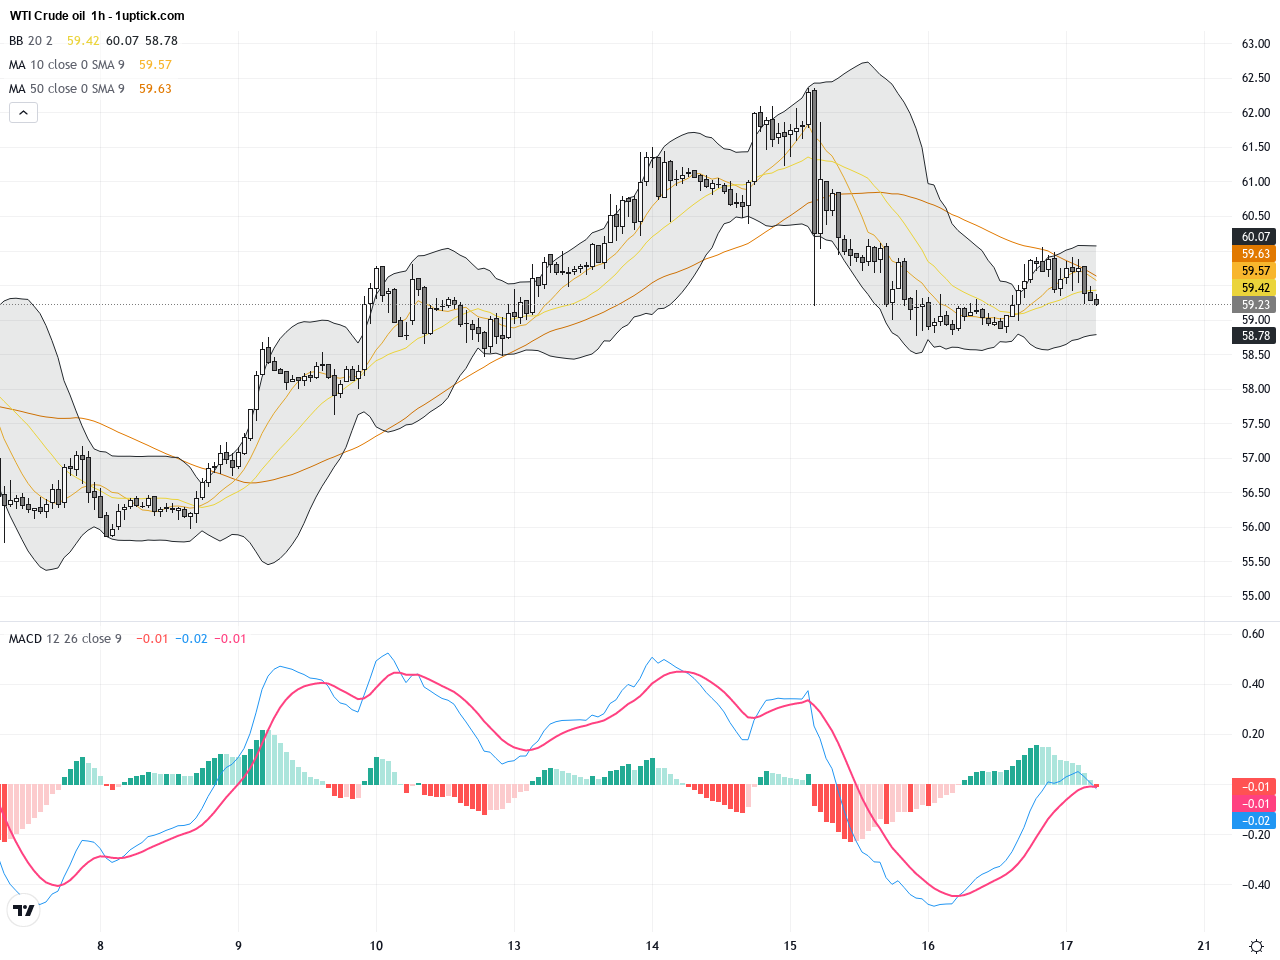
On the hourly chart, WTI has formed a short-term consolidation pattern over the past 3-5 days, repeatedly testing the critical $58.3 support level and holding above it. The short-term moving averages (e.g., 5 and 20 SMA) are showing a bullish crossover, supported by a recovering MACD histogram, suggesting upside momentum in the near term. The Bollinger Bands are expanding slightly, implying increased volatility and setting the stage for a potential breakout. However, immediate resistance remains significant and must be monitored.
Technical Trend: The current trend for WTI Crude Oil is best described as a cautiously bullish consolidation, with mixed technical and fundamental signals favoring a tentative uptrend in the short term while maintaining a neutral longer-term stance.
Technically, WTI Crude Oil sits on a critical support zone near $58.3. Recent hourly 5/20 SMA bullish crossover along with a rising MACD histogram suggest a short-term resurgence in momentum. The daily Bollinger Bands contraction points to an impending volatility expansion, potentially triggered by a break above the $60 resistance. However, volume levels remain subdued, advising caution against false breakouts. Market participants should track the interplay between key support and resistance, factoring in geopolitical developments, as speculative net longs have slightly increased, indicating moderately rising bullish interest.There are no significant or directly relevant economic events scheduled today in the GMT+1 timezone that would impact WTI Crude Oil prices. Given WTI’s sensitivity is primarily to geopolitical dynamics and supply-demand fundamentals, traders should remain focused on geopolitical news flow and inventory reports for directional cues.
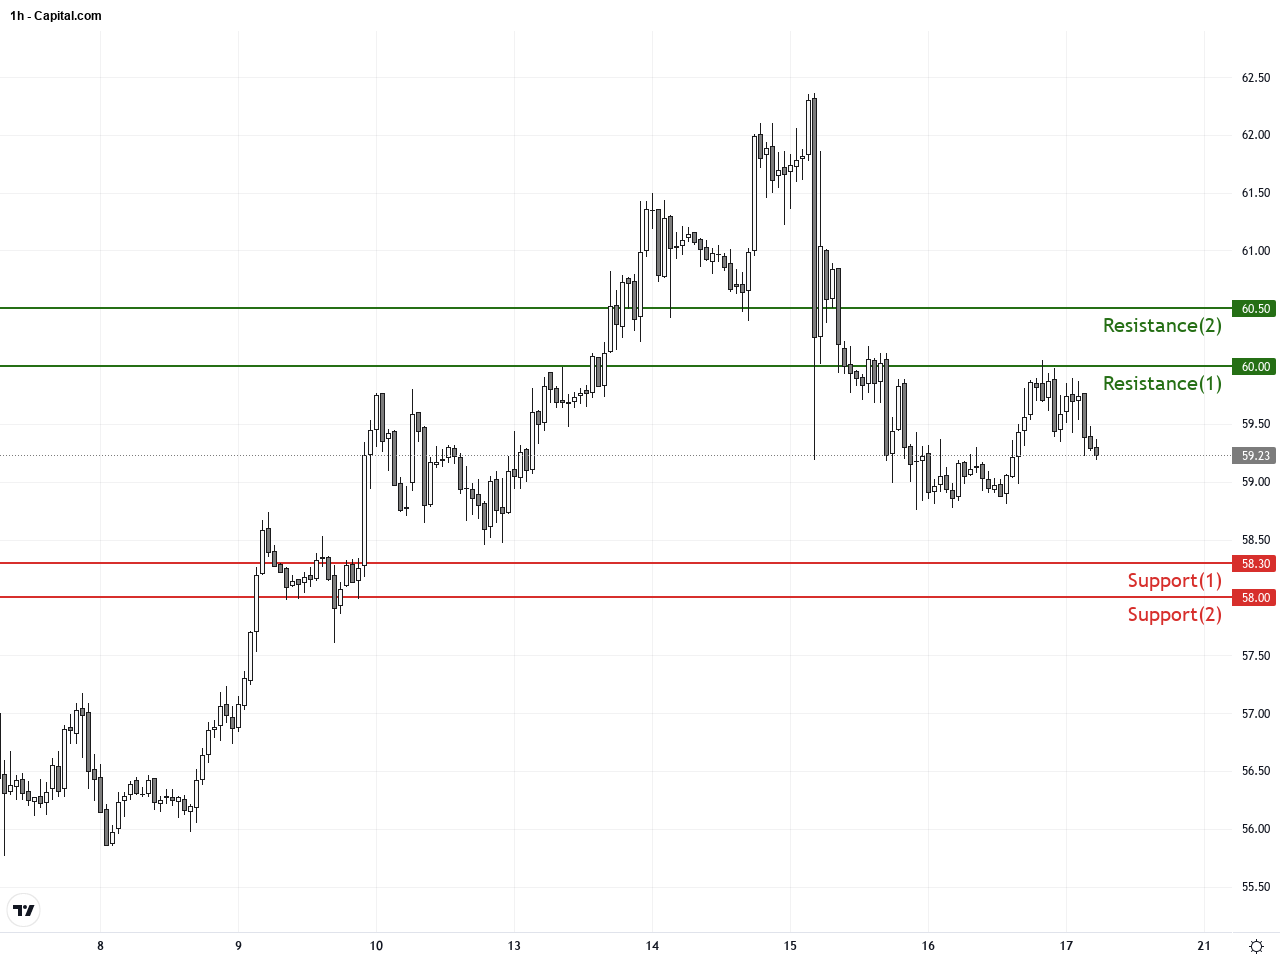
Resistance & Support
The above financial market data, quotes, charts, statistics, exchange rates, news, research, analysis, buy or sell ratings, financial education, and other information are for reference only. Before making any trades based on this information, you should consult independent professional advice to verify pricing data or obtain more detailed market information. 1uptick.com should not be regarded as soliciting any subscriber or visitor to execute any trade. You are solely responsible for all of your own trading decisions.