


 |
| Gold V.1.3.1 signal Telegram Channel (English) |

USDJPY: Key Support and Resistance Levels with Crucial Technical Pattern Insights
2026-02-13 @ 11:01
Over the past 24 to 48 hours, the USD/JPY exchange rate experienced notable volatility, with the pair pulling back from yesterday’s closing price around 153.16 to fluctuate between 152.30 and 152.65. The Japanese yen strengthened amid rising Bank of Japan (BoJ) rate hike bets and anticipation of the upcoming US Consumer Price Index (CPI) report, pushing the pair lower. Market concerns over narrowing US-Japan yield differentials further reinforced bearish sentiment toward the dollar.
In layman’s terms, for the average investor, the forex market during this period was like awaiting a crucial market signal — the US inflation data. As the US CPI release neared, traders adopted a cautious stance, re-evaluating dollar momentum and risks, while the yen gained defensive strength supported by Japanese officials’ intervention talk. Under these conditions, investors might notice that short-term fluctuations in USD/JPY are becoming more frequent and less predictable, underscoring the need to pay close attention to fundamental news and central bank policy shifts when trading forex.
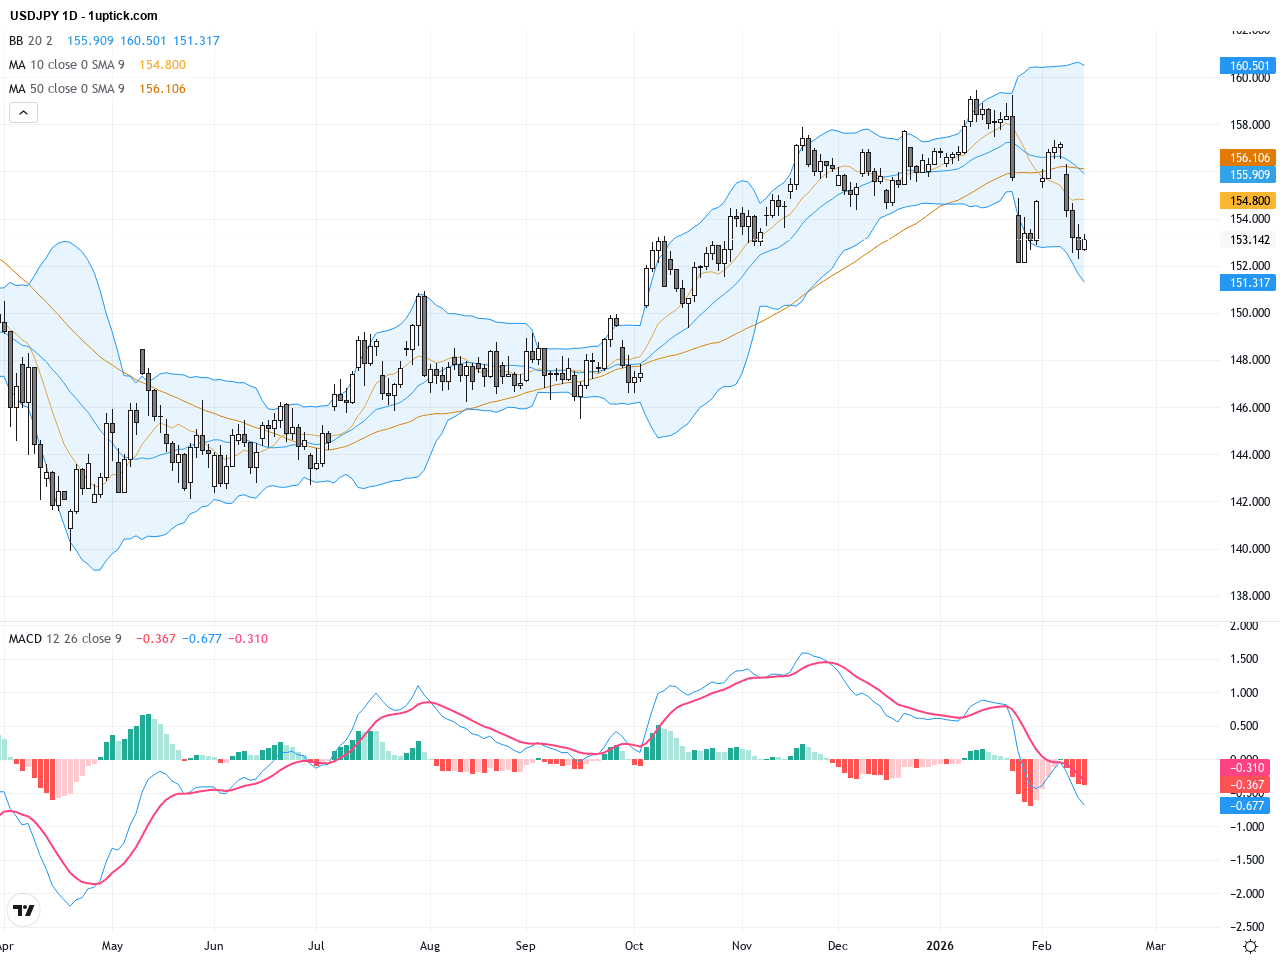
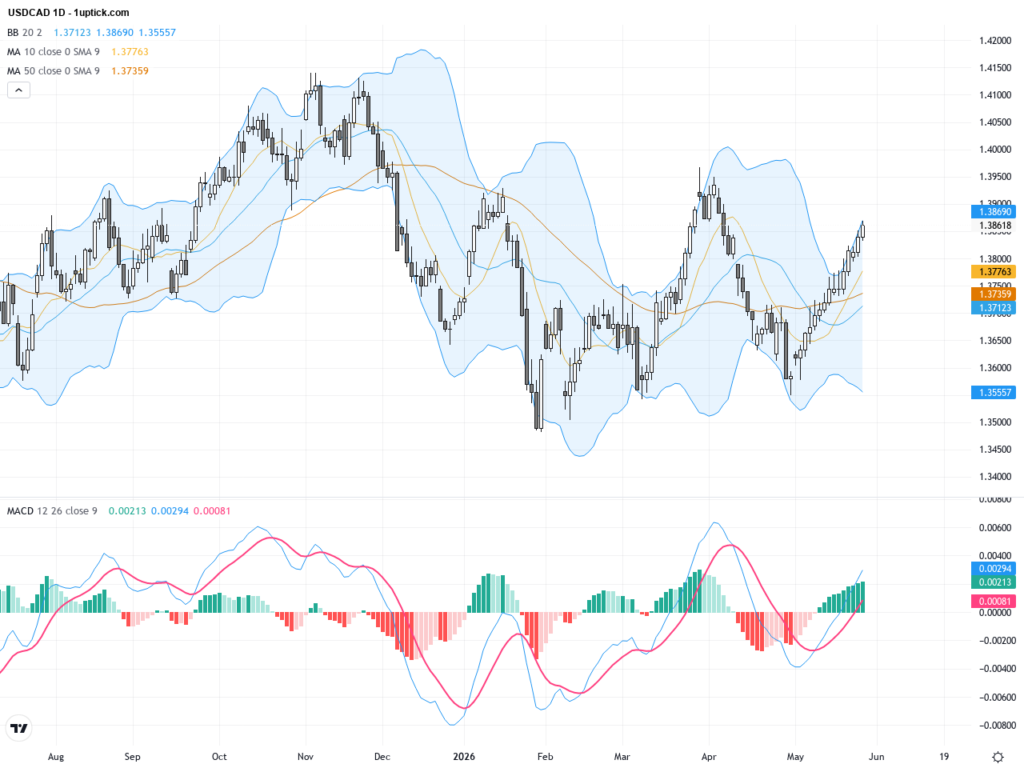
Reviewing the daily chart, USDJPY has been fluctuating within a range of approximately 150 to 157 recently. The 5-day moving average briefly crossed above the 20-day and 50-day averages, suggesting a mid-term bullish attempt, but the pair failed to break through the 156 resistance decisively. Bollinger Bands are contracting, indicating reduced volatility and ongoing consolidation. The MACD hovers near the zero line with shrinking histogram bars, reflecting an unclear trend direction. Overall, the daily chart shows a battle between bulls and bears, with a decisive break above 156 potentially signaling a new upward trend.
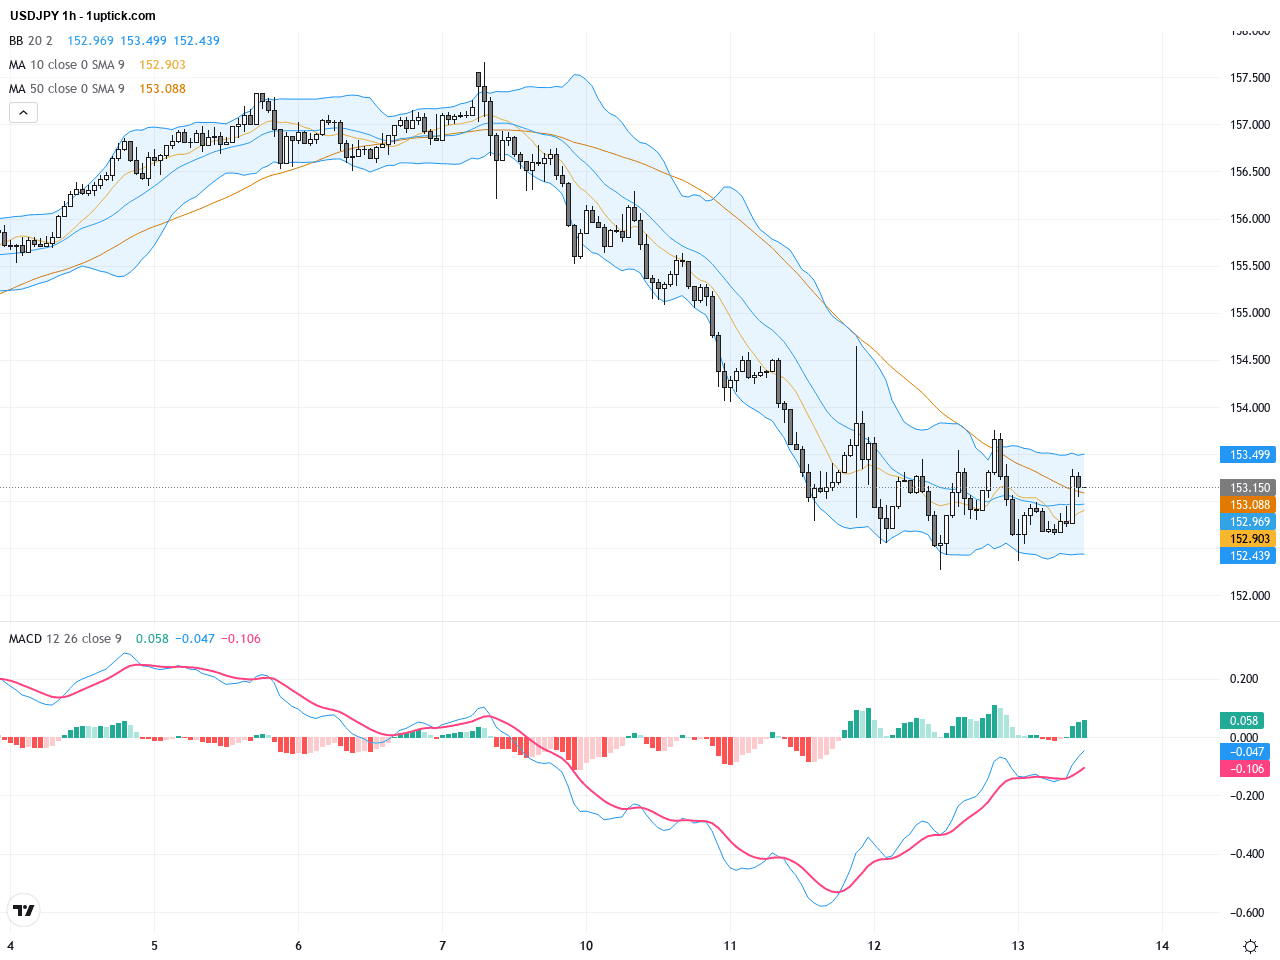
On the hourly chart spanning the last 5 days, USDJPY has formed a descending triangle pattern starting around February 9, with support near 152.30 tested multiple times and lower highs near 153.00, indicating increasing selling pressure. A recent significant bearish engulfing candle near 152.60 revealed short-term buying interest, though the prevailing trend remains bearish. The MACD shows a bearish crossover while RSI stays around 40, implying near-term downside risk and the need for vigilance around a potential breakdown below support.
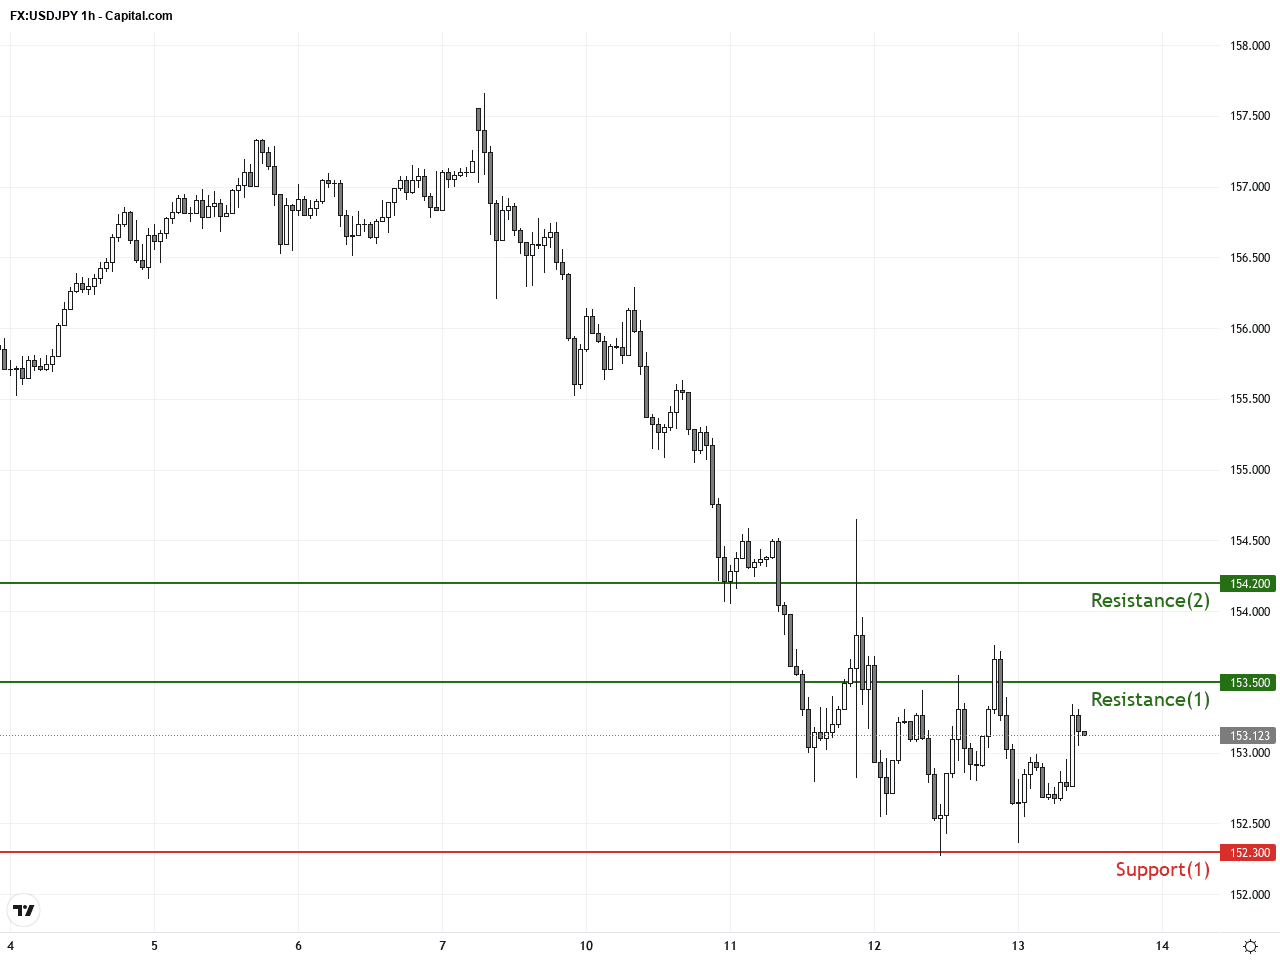
Technical Trend: The current trend for USDJPY is best described as ‘Cautiously Consolidating’, with the pair oscillating between 152.30 and 153.50 amid strong battle between bulls and bears, lacking a clear breakout. This phase entails elevated volatility and requires flexible position management keyed to news and technical cues.
USDJPY’s technical setup suggests a cautious testing phase with Bollinger Bands tightening, implying an impending breakout. The 5-day and 20-day moving averages are losing bullish momentum, while the MACD bearish crossover and neutral-to-lower RSI highlight short-term selling pressure. The recent bearish engulfing candle signals heightened selling interest, emphasizing vigilance for a decisive break below the 152.30 support. Overall, technical indicators call for cautious observation waiting on clear direction from US CPI data.Today presents no directly significant economic events impacting USDJPY. However, market participants should focus on the upcoming US Consumer Price Index (CPI) and Core CPI releases at 14:30 GMT+1. Should the inflation data surpass expectations, the US dollar could strengthen, lifting USDJPY prices. Conversely, softer data may boost the yen under safe-haven demand, pushing USDJPY lower. Japan has no major data scheduled today, so price action will likely hinge on US inflation outcomes and risk sentiment.
Resistance & Support
The above financial market data, quotes, charts, statistics, exchange rates, news, research, analysis, buy or sell ratings, financial education, and other information are for reference only. Before making any trades based on this information, you should consult independent professional advice to verify pricing data or obtain more detailed market information. 1uptick.com should not be regarded as soliciting any subscriber or visitor to execute any trade. You are solely responsible for all of your own trading decisions.