


 |
| Gold V.1.3.1 signal Telegram Channel (English) |

The World’s Most Expensive Traffic Jam: How One Narrow Strait Broke Everything From Your Gas Tank to Your GPU
2026-04-03 @ 17:14
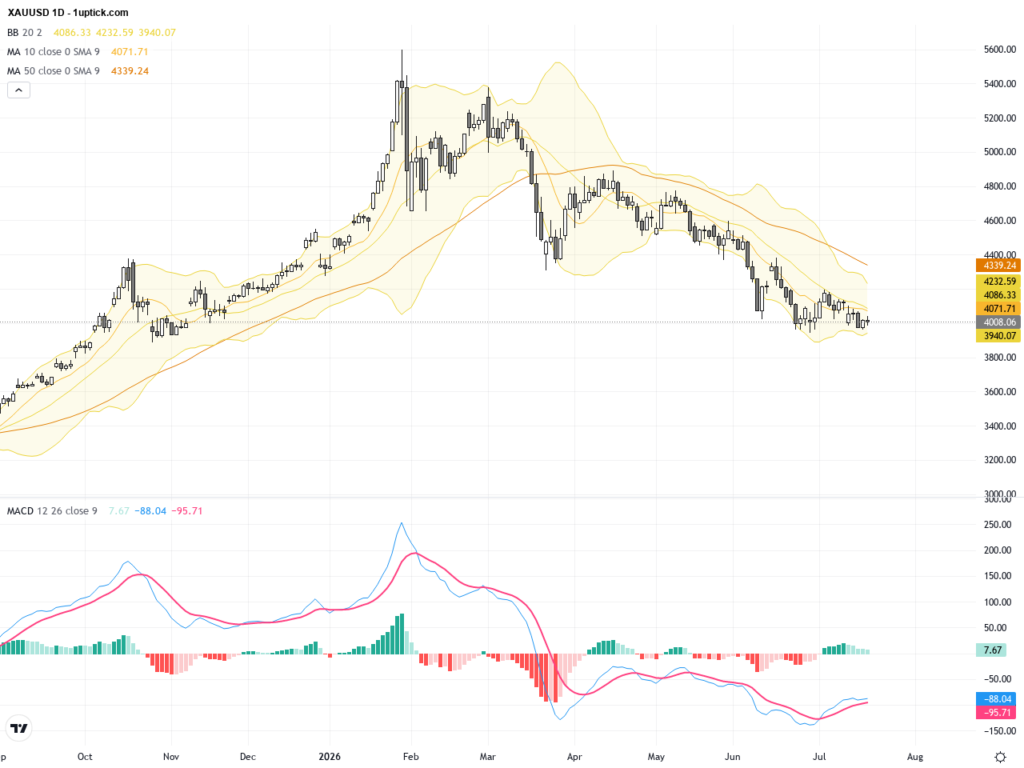
 It’s March 2026. Brent crude has gone from $55 to $110 per barrel in roughly the time it takes most people to finish a Netflix series. The Strait of Hormuz—a 21-mile-wide bottleneck through which 20 percent of the world’s oil casually commutes every single day—has been effectively shut down by Iran. Flows are at less than 10 percent of normal. The International Energy Agency is calling it the largest supply shock in the history of global crude markets. Goldman Sachs is raising recession odds like a poker player who just saw the river card. And Gen Z, already stretched thinner than a startup’s Series A runway, is getting hit from both sides: gas prices eating their paychecks while their hospitality jobs evaporate at a rate of 5,000 per month.
In other words: the global economy looked at itself in the mirror, whispered “I’m in danger,” and meant it.
Now, if you’re a casual observer, you might think this is just another oil shock. Prices spike, talking heads yell on cable news, prices come back down, everyone forgets. We’ve done this dance in 1973, 1979, and 1990. But here’s the thing that makes the 2026 vintage uniquely terrifying: this time, the exit doors are blocked.
In 1973, the OPEC embargo lasted three months and ended with diplomatic pressure. In 1990, Saddam invaded Kuwait and the U.S.-led coalition wrapped things up so fast the oil spike barely had time to settle into its chair. But in 2026? Iran controls the physical chokepoint. There’s no military quick-fix that doesn’t risk turning the entire Persian Gulf into a no-go zone. And diplomatic negotiations—while Trump has extended them, earning a brief sigh of relief from markets—haven’t produced anything resembling a credible timeline for reopening.
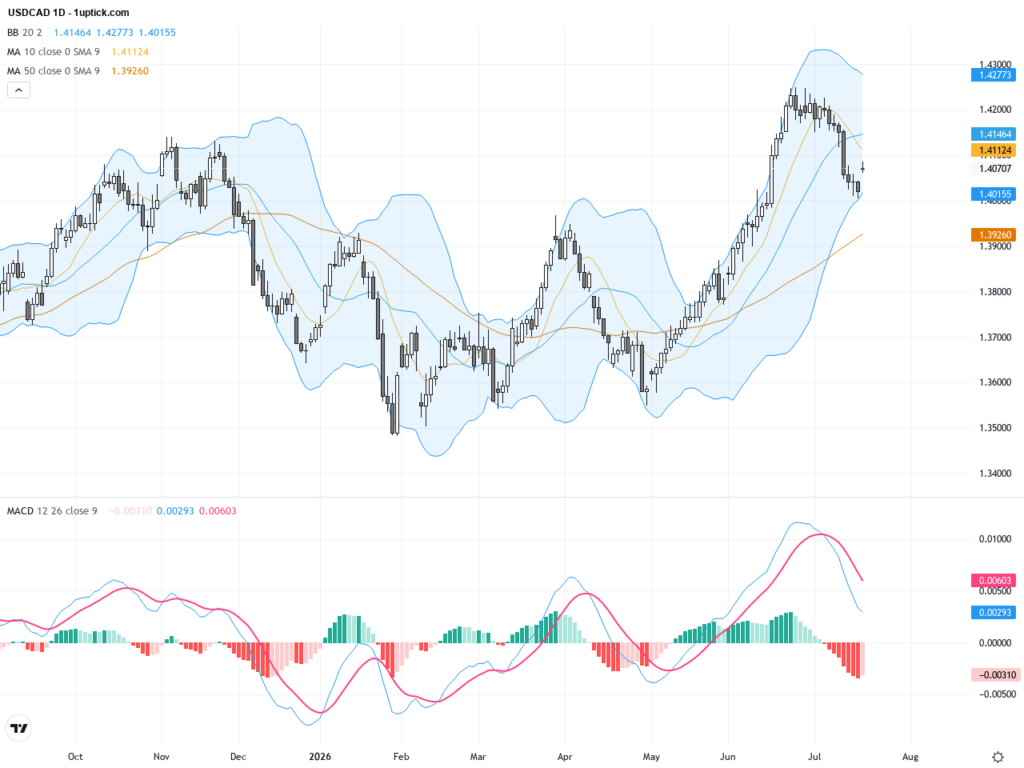
The oil futures curve tells the story beautifully. April contracts are at $103. December contracts are at $73. That $30 gap is the market’s way of saying: “We think this gets resolved in six months, but honestly, we’re not sure, and we’re pricing our uncertainty in real dollars.” It’s the financial equivalent of booking a refundable hotel room.
Why This Oil Shock Is Actually a Helium Shock in Disguise
Here’s where we leave the CNBC headline zone and enter the territory that actually matters for your portfolio and your life.
The financial concept you need to understand is second-order supply chain contagion—and the best analogy I can give you is this:
Imagine the global economy is a Jenga tower. Oil is the big obvious block near the bottom that everyone’s staring at. But helium? Helium is that weird skinny block three layers up that nobody’s been paying attention to—the one that, when it slides out, takes the entire top half of the tower with it.
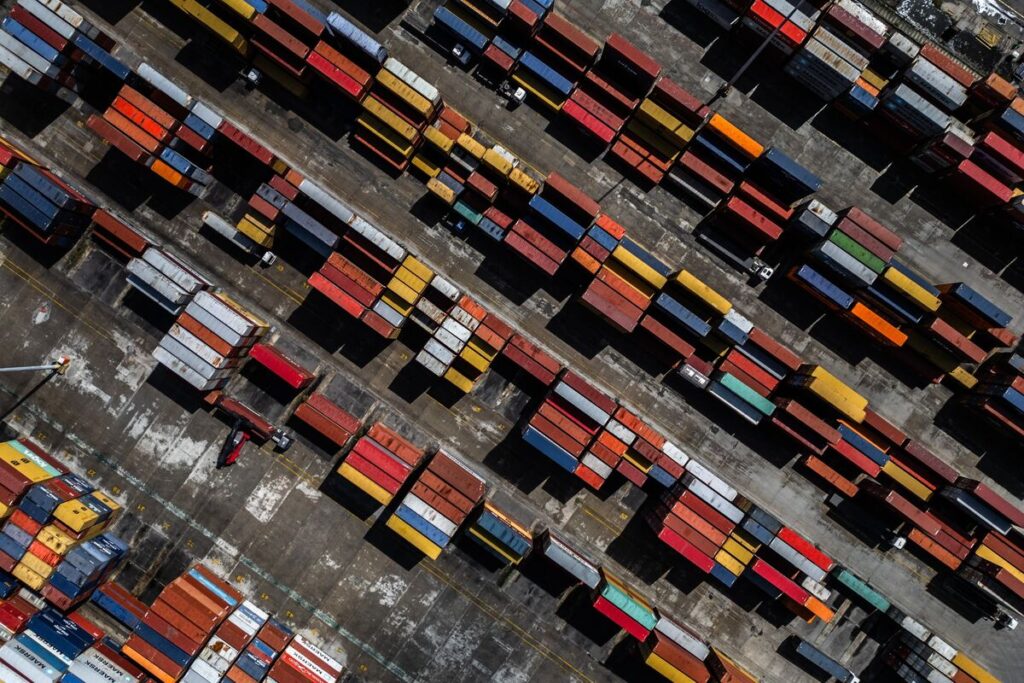
Here’s why. Qatar supplies roughly 30 percent of the world’s helium. Helium is a byproduct of LNG extraction—you literally cannot make it on purpose without processing natural gas. The Ras Laffan complex in Qatar, one of the largest helium production facilities on Earth, got knocked offline. And because the Strait of Hormuz is closed, even the helium that was already produced can’t get out efficiently. Rerouting around the Cape of Good Hope adds 3,500 nautical miles, $1 million in fuel costs per voyage, and 10-14 extra days of transit. And here’s the kicker: helium must be transported in specialized cryogenic containers kept at negative 268.9 degrees Celsius. These containers can only hold helium for 35-48 days before it literally starts warming up, converting back to gas, and escaping through pressure valves like a ghost leaving a haunted house.
So it’s not just expensive to reroute. The helium physically disappears if the trip takes too long.
Now, why should you care about helium? Because it’s essential for semiconductor manufacturing. Every advanced chip—your DRAM, your HBM memory for AI servers, your logic processors—requires helium during fabrication. When helium supply tightens, defect rates rise, cost per good die increases, and output falls. Samsung and SK Hynix fabs in South Korea maintain about six months of strategic reserves but only one week of on-site inventory. After early April 2026, when existing shipments stop arriving, production constraints become immediate. Not “we’ll pay more” constraints. “There is no helium to buy at any price” constraints.
This means the 2026 oil crisis isn’t just an oil crisis. It’s an everything crisis wearing an oil costume. Fertilizer prices are up 26 percent (urea) and 17 percent (DAP) because a third of global shipments pass through Hormuz. Asian petrochemical crackers are declaring force majeure. Polyethylene prices are surging. And TSMC’s CoWoS packaging capacity for AI chips—already sold out through mid-2026 before any of this happened—now faces upstream helium constraints that compound the bottleneck.
The Jenga block nobody was watching is sliding out, and the tower is wobbling.
The Historical Remix: Same Song, Different Key
Let’s do the speed round on historical oil shocks, because context is everything and also because I want you to feel smart at your next dinner party.
1973 (The OG): OPEC embargo. Oil quadrupled from $3 to $12. Lasted three months. Created the word “stagflation.” Your parents’ parents remember gas lines. Key lesson: coordinated producer action can override market fundamentals, but political pressure eventually creates resolution.
1979 (The Sequel Nobody Asked For): Iranian Revolution. Production dropped only 4 percent, but prices doubled to $39.50. Why? Because markets don’t price barrels—they price fear. The perceived permanence of disruption matters more than the actual volume lost. This is the single most important insight for understanding 2026.
1990 (The Quick One): Iraq invades Kuwait. Oil goes from $17 to $36 in three months—a 112 percent spike. But the U.S.-led coalition won so decisively and so quickly that prices collapsed almost as fast as they rose. Key lesson: geopolitical shocks are only as durable as the geopolitical problem.
2026 (The One Where Nobody Knows the Ending): Combines the worst features of all three predecessors. The chokepoint control of 1973, the perceived permanence of 1979, and the military complexity that prevented the quick resolution of 1990. Oh, and it also breaks helium, fertilizers, petrochemicals, and semiconductor supply chains simultaneously, which none of the previous three managed. Overachiever.
The Money Part: Who Wins, Who Loses, Who’s Pretending
Let’s talk portfolio positioning, because that’s why you’re actually reading this.
The Winners (So Far): Energy stocks are up 30 percent year-to-date. Valero is up 68.56 percent. APA Corp, 66.94 percent. Marathon Petroleum, 47 percent. Baker Hughes, 45.82 percent. Halliburton, 45.22 percent. These aren’t random gains—they reflect sophisticated money flowing into downstream refining and energy services names, not just generic “oil go up” plays. The crack spreads (the margin between crude input costs and refined product output prices) remain robust at $8-$12 per barrel, meaning refiners are printing money even as crude prices stabilize.
The Losers: Leisure and hospitality (losing ~5,000 jobs per month). Retail trade (~2,000 jobs per month). Gen Z workers getting squeezed from both directions. Asian semiconductor manufacturers facing helium constraints. Petrochemical consumers—packaging, automotive, construction—eating margin compression. And central bankers, who are losing sleep because their policy toolkit was designed for demand shocks, not supply shocks, and they’re staring at a stagflationary trilemma with no good answers.
The Pretenders: Retail investors in Hong Kong who panic-sold HK$27.7 billion on March 19 when headlines were scary, then panic-bought HK$37.2 billion two days later when headlines turned hopeful. That’s not investing. That’s emotional day-trading with a Bloomberg terminal and a cortisol addiction. The market’s behavioral pattern during energy shocks is brutally consistent: retail buys high and sells low, because loss aversion makes you sell into panic and recency bias makes you buy into relief rallies. The institutional traders on the other side of those trades send thank-you cards.
The Structural Weirdness: Crude Surplus Meets Product Scarcity
Here’s a fact that will short-circuit most casual analysis: before the war even started, the IEA projected a 3.7-million-barrel-per-day surplus in 2026. The largest non-crisis imbalance in modern history. Supply growth of 3 million barrels daily against demand growth of only 830,000. By normal logic, oil should have been cheap.
But “normal logic” doesn’t account for a world where crude is theoretically abundant but refined products are structurally scarce. New mega-refineries in Kuwait (Al-Zour, 615,000 bpd), Oman (Duqm), and the UAE (Ruwais) were coming online simultaneously—all positioned in the Middle East, all now constrained by the same Hormuz closure that limits crude flows. The Atlantic Basin is undersupplied for refined products even though crude is plentiful on paper. It’s like having a warehouse full of flour during a bread shortage because all the bakeries are closed.
This “two-speed market” creates a specific opportunity: integrated energy companies with downstream refining exposure in Europe and North America benefit from product price appreciation exceeding crude cost increases. Pure upstream producers? Less so. If you’re positioned only in crude exposure, you’re playing checkers. The smart money is playing three-dimensional refining-margin chess.
The China Variable and India’s Invisible Price Floor
Two underappreciated factors that will determine whether oil stays at $100+ or retreats to $70:
China: Historically responsible for ~70 percent of global oil demand growth. Current forecasts: flat to 1 percent growth in 2026, dragged down by EV adoption eating gasoline demand and a sluggish property sector. But China has been quietly building strategic reserves at ~750,000 barrels per day throughout 2025, buying cheap to hedge against exactly this scenario. If Beijing unleashes fiscal stimulus and the property sector recovers, demand reaccelerates and crude goes to $150. If China stays sluggish, crude drifts toward $70. This is the most consequential binary variable in global energy markets right now, and nobody can predict it with confidence.
India: The stealth factor. India has frozen fuel prices despite oil surging above $155 per barrel at points. Per-capita consumption is 1.2 barrels per year (versus 22 in the U.S.)—this isn’t discretionary demand that gets trimmed; it’s the bare minimum to keep an economy running. Goldman estimates India can sustain subsidies for 18-24 months without fiscal crisis. Similar programs in Indonesia, Malaysia, and Egypt collectively insulate ~8.5 million barrels per day from price signals. This creates a structural demand floor that didn’t exist in previous oil shocks. The price at which major consumers implement rationing is now $90-100, not $50-60. The floor has moved up, permanently.
The Central Bank Paralysis: A Comedy in Three Acts
Act I—The Fed: Held rates at 3.5-3.75 percent. Chair Powell’s statement amounted to “this is concerning but we’re not doing anything yet.” Goldman expects two quarter-point cuts in September and December. Translation: the Fed is going to sit in the corner and hope the geopolitics resolve themselves, because their toolkit doesn’t include a “fix Iran” button.
Act II—The ECB: Facing potential euro-area recession if energy prices stay elevated. But cutting rates risks de-anchoring inflation expectations. So they’re stuck. The official position is “we’re in a solid position to respond,” which is central banker for “we have no idea what to do but we’d like you to remain calm.”
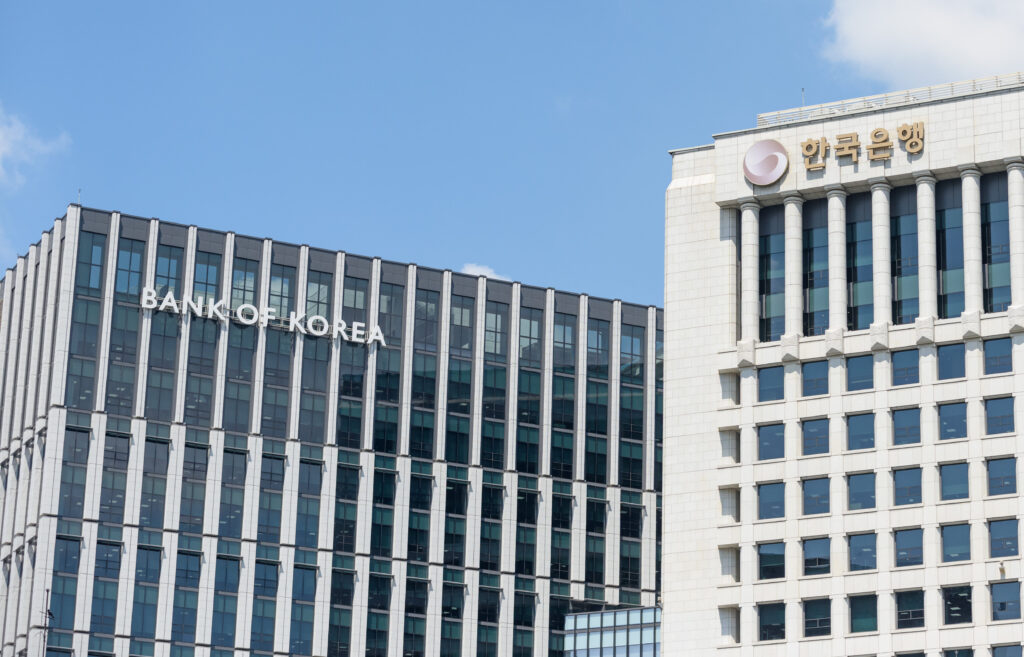
Act III—The BOJ: In the most ironic twist, the Bank of Japan—which spent decades fighting deflation—is now considering rate hikes because the oil shock is generating inflation they actually don’t want. After years of begging prices to go up, prices went up, and now they’re unhappy about it. Be careful what you wish for, monetary policy edition.
The Playbook: Three Time Horizons, Three Strategies
Tactical (2-4 weeks): This is noise zone. Headlines dominate. VIX at 31 says elevated but not panicking. If you’re trading this window, you’re gambling on geopolitical headlines, and I’d rather bet on a coin flip because at least I understand the probability distribution. Stay disciplined. Don’t chase.
Medium-term (2-6 months): This is where the money gets made. Energy stocks with downstream integration and dividend yields offer total return opportunity—price appreciation from elevated crude plus yield advantage over bonds. Systematic profit-taking as crude establishes multi-week highs, with redeployment into beaten-down consumer cyclicals (retail, hospitality, leisure) trading at depressed valuations due to temporary demand destruction fears. The rotation from energy to consumer recovery is the core alpha-generating trade of 2026.
Structural (6+ months): Persian Gulf geopolitical risk is permanently repriced. Goldman’s 2027 Brent base case is $80—not a return to pre-war $55, but a new equilibrium with higher embedded risk premium. Long-duration energy infrastructure, exploration and production companies, and inflation-linked bonds all benefit from this structural shift. Portfolio construction should incorporate ~1.3 percent tail-risk protection (puts or vol strategies) to mathematically justify ~1.5 percent increase in equity beta. The hedge isn’t the return generator—it’s the permission slip to take more risk in core positions.
The 2026 Strait of Hormuz crisis is not your grandfather’s oil shock. It’s an oil shock, a helium shock, a fertilizer shock, a petrochemical shock, and a semiconductor shock wearing a trench coat pretending to be one crisis. The global economy routed 20 percent of its oil, 20 percent of its LNG, 30 percent of its helium, and 33 percent of its urea through a 21-mile-wide chokepoint and then acted surprised when someone closed it.
The single-point-of-failure architecture of global energy infrastructure has been stress-tested, and it failed the test. Whether this particular crisis resolves in weeks or months, the structural lesson is permanent: concentration risk in critical supply chains is an unhedged tail risk that markets systematically underprice until the tail event occurs.
For investors, the opportunity is real but requires discipline. Energy exposure pays in the shock phase. Integrated refining margin plays pay in the persistence phase. Consumer cyclical recovery pays in the normalization phase. And the investors who rotate systematically through these phases—rather than panic-buying energy at the top and panic-selling consumer names at the bottom—will capture the alpha that the crisis creates.
Just don’t be the person who panic-sold HK$27.7 billion on a Wednesday and panic-bought HK$37.2 billion on a Friday. That person is not having a good year.