


 |
| Gold V.1.3.1 signal Telegram Channel (English) |

China’s Industrial Profits Soar 15.8% in March Despite Iran War Oil Shock, Showcasing Manufacturing Resilience
2026-04-27 @ 13:02
How did China’s manufacturing defy rising oil prices triggered by the Iran war?
March saw a global energy shock as the US-Israel conflict with Iran tightened supplies through the crucial Strait of Hormuz, sending oil prices soaring and rattling markets worldwide. Yet amid this energy storm, China’s industrial profits surged by an impressive 15.8%. It’s a surprising jump that reveals a lot about the structural strengths underpinning China’s manufacturing sector right now.
At the core of this resilience is China’s diversified energy playbook. Unlike many global peers heavily dependent on imported oil and gas, Chinese factories lean heavily on domestically produced coal and a growing share of renewables to fuel production. This energy diversity has been a critical buffer, preventing input cost explosions from hammering factory margins despite raw material prices—especially for plastics and chemicals—jumping by over 25%.
Still, it’s not all sunshine. Energy-intensive industries like plastics and chemicals, which rely substantially on imported oil and Middle East supply chains, are feeling cost pressures keenly. Iranian oil and gas imports have faced disruptions, compounded by US sanctions restricting China-Iran trade. Latest market reports point to at least a 10% rise in plastics prices just in March, a cost spike that’s squeezing downstream manufacturers and nudging prices higher for consumers.
When it comes to exports, the strain is also visible. China’s March exports expanded just 2.5% year-over-year—a dramatic slowdown from earlier 22% growth—highlighting how geopolitical tensions are complicating global supply chains and logistics. Restrictions on Middle Eastern trade routes and tighter transport costs continue to weigh on export-heavy sectors.
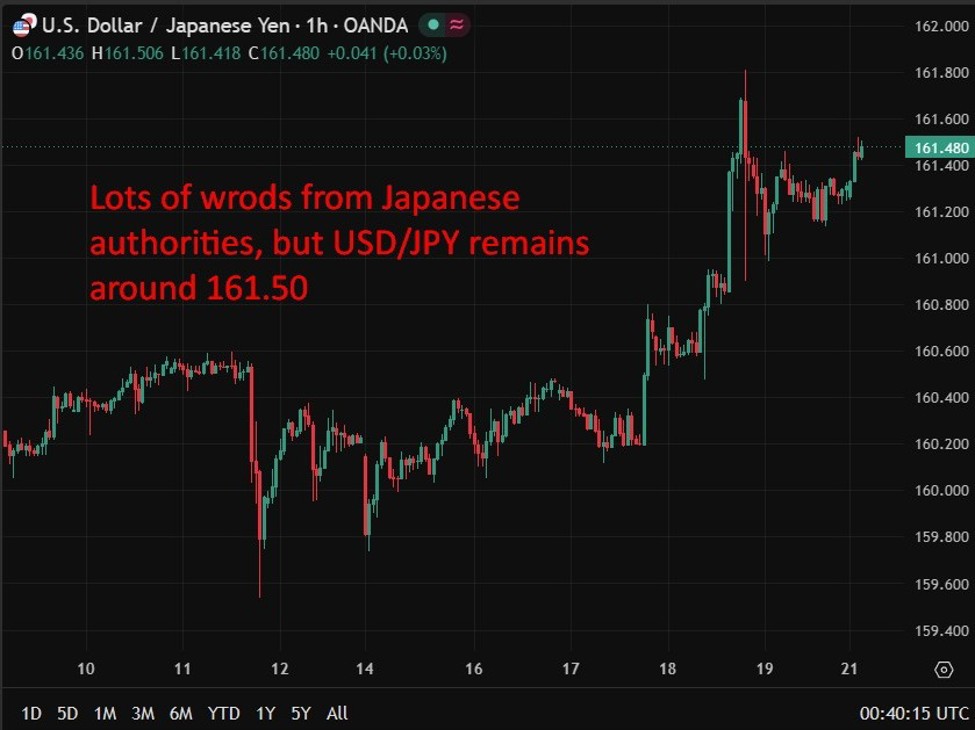
On the currency front, the Chinese yuan is under some mild depreciation pressure—largely due to rising energy import risks and a broadly strong US dollar backed by Washington’s geopolitical leverage. But thanks to China’s diversified suppliers, these currency swings have been relatively muted, avoiding excessive market volatility.
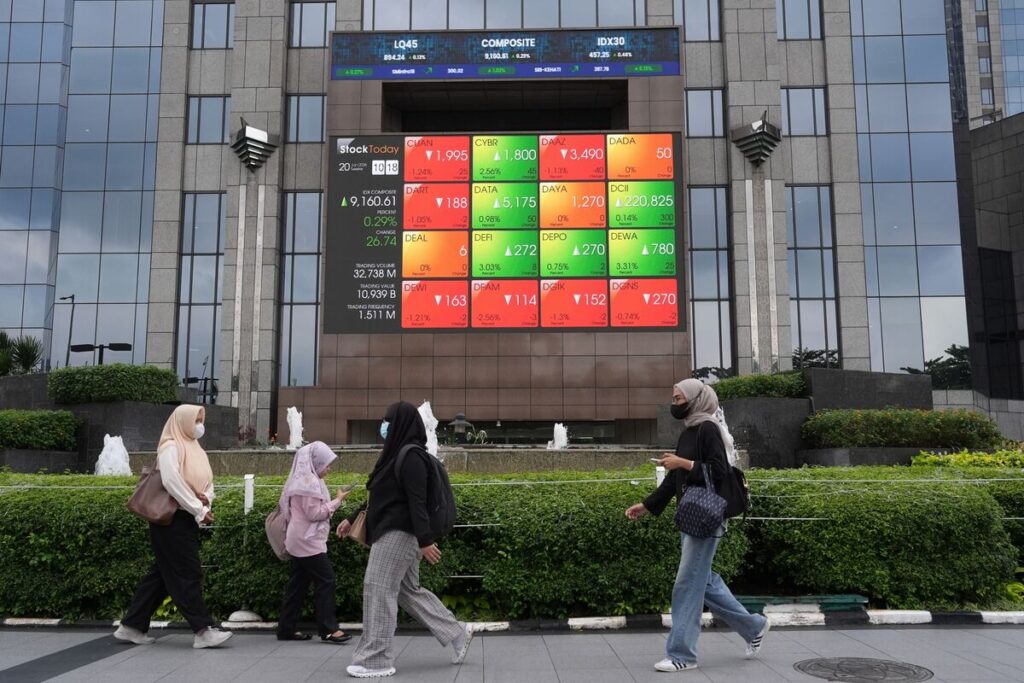
Stock markets have mirrored this split picture. Manufacturing and export-related shares have shown solid resilience buoyed by profit gains. Conversely, sectors tied closely to consumer goods are under pressure from surging input costs. Bond markets remain steady, anchored by strategic reserves and renewable energy supplies that temper inflation risks. However, the IMF recently trimmed China’s 2026 GDP growth forecast to 4.4%, citing the export slowdown in March as a key factor.
What’s next on the horizon?
The big question is how long this energy supply squeeze will last. Prolonged disruptions in the Strait of Hormuz or escalating US-China tensions over Iranian oil could further weaken China’s export recovery. Energy-intensive manufacturing sectors may see costs climb another 10%, fueling commodity price inflation and squeezing margins. Watching upcoming trade figures, export breakdowns, and shipping flows through Hormuz will be crucial to gauge if China can maintain its current edge.
In short, China’s massive strategic oil reserves and diverse energy mix have so far paid off, allowing its manufacturing sector to weather a volatile period with surprising strength. But the global political and energy landscape remains fluid. Investors, businesses, and policymakers should keep a close eye on geopolitical developments and supply chain shifts in the months ahead.
The next trade data release might just tell us if China’s factories can hold the line or if the global energy shockwave will eventually leave a bigger dent.