


 |
| Gold V.1.3.1 signal Telegram Channel (English) |

AUDUSD Technical Update: Bulls Rally Above 0.7090 Key Support Amid Risk Sentiment Boost
2026-04-29 @ 06:01
Over the past 24 to 48 hours, the AUD/USD pair has traded between 0.715 and 0.719, closing yesterday at 0.7181, near its yearly high of 0.72218. Market movements have been primarily driven by shifting risk sentiment, with the Australian dollar benefiting from increased investor appetite for risk and initiating a fresh bullish impulse above the key 0.7090 support level.
Recent market news highlights that Iran’s conciliatory signals regarding a critical oil shipping route have eased supply concerns, boosting market confidence and aiding AUD’s rebound. Additionally, ongoing US-Iran ceasefire talks have pressured the safe-haven US dollar, giving the Aussie short-term support. Despite fluctuations caused by US economic and employment data, the overall rise in risk sentiment has kept the Australian dollar on a firm footing.
For an average investor, this scenario could be likened to a high-rated stock propelled by optimistic market sentiment. The recent strength in AUD is largely linked to broader geopolitical developments and changes in energy supply risks. Understanding these shifting dynamics offers investors a valuable perspective on what’s driving the currency’s moves and helps in anticipating its next trends.
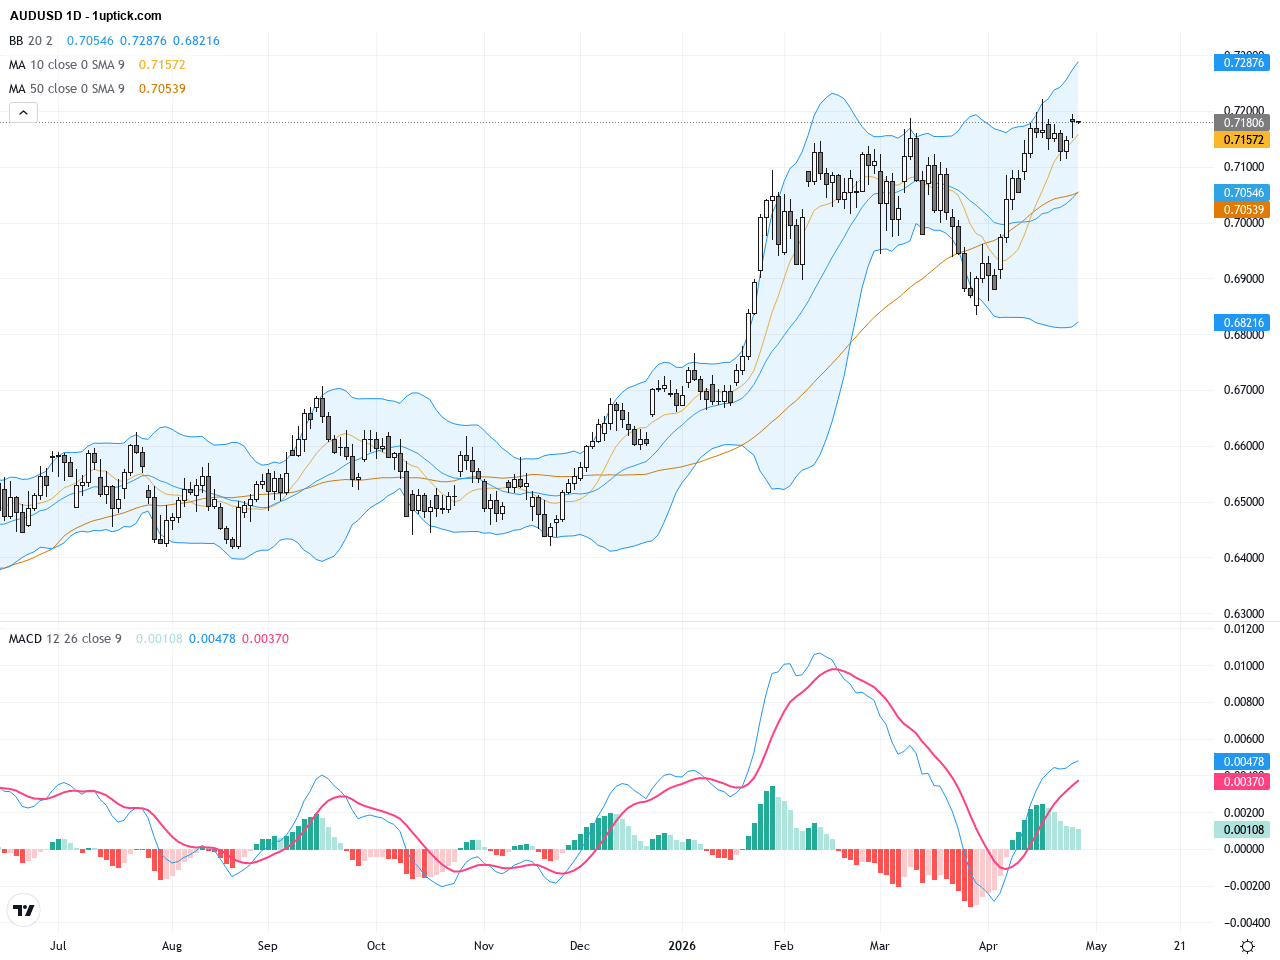
The daily chart displays AUDUSD’s sustained uptrend since the start of the year, with recent price action breaking above resistance near 0.71 and confirming 0.7090 as strong support. Bollinger Bands have expanded, indicating increased volatility. The 50-day moving average (~0.7035) remains above the 200-day average (~0.6776), confirming an ongoing bullish trend. The MACD maintains positive momentum with expanding histogram bars, supporting further upside potential.
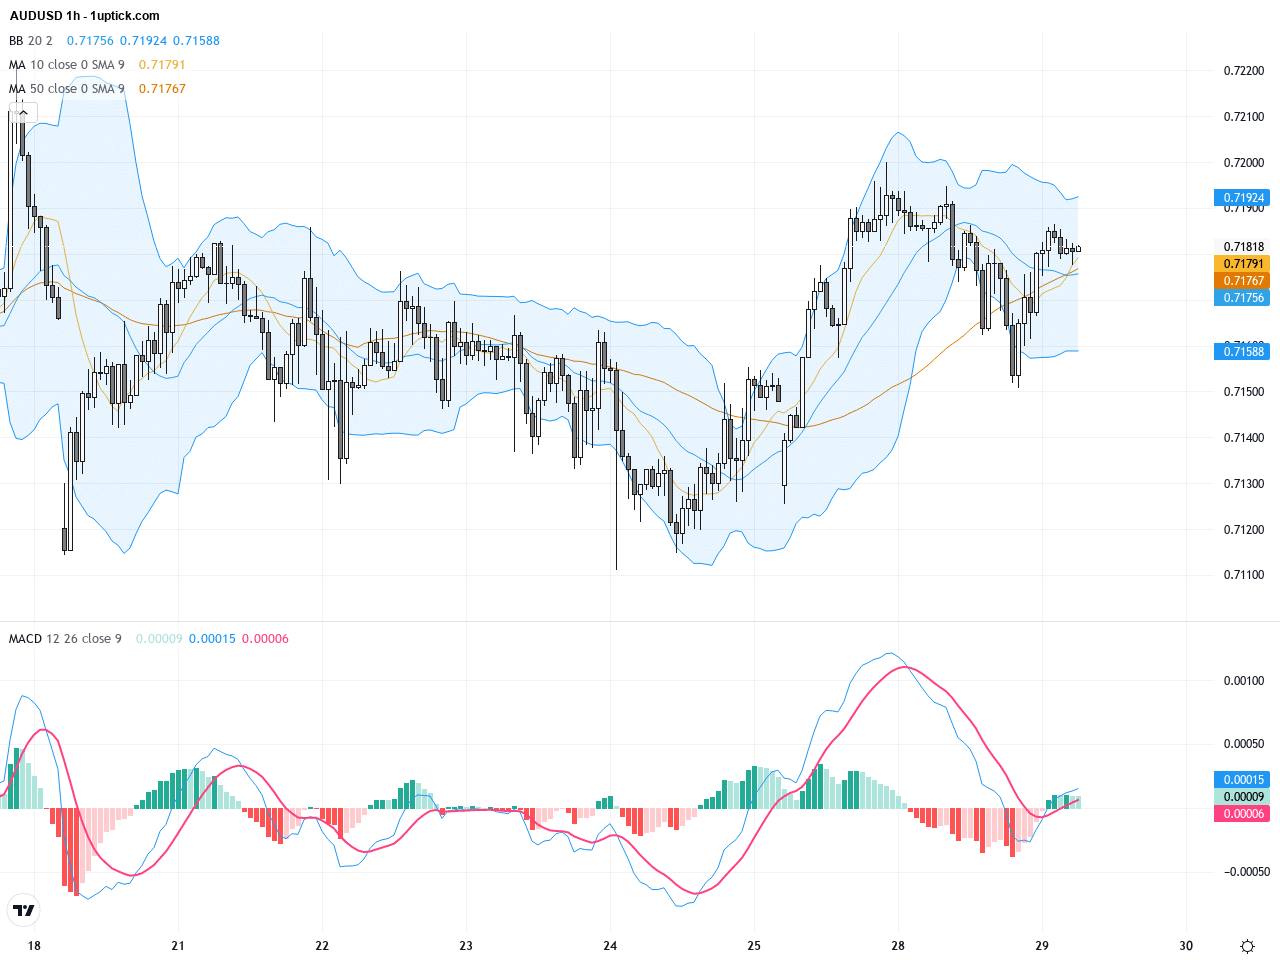
On the hourly chart spanning the last 3-5 days, AUDUSD shows an upward oscillation, recently testing resistance around 0.7195. Short-term moving averages align bullishly, with the 50 EMA crossing above the 100 EMA, signaling strengthening momentum. The MACD hints at a bullish crossover soon, while tightening Bollinger Bands suggest an end to consolidation and potential breakout. A recent hammer candlestick with a long lower wick highlights fresh buying interest rejecting lower prices.
Technical Trend: The trend remains cautiously bullish, showing steady upward momentum with intermittent consolidation as the market awaits key economic data to confirm the next leg higher.
Technical highlights include a firm bullish reversal sequence established at 0.7090 support, with the daily MACD maintaining upward momentum and expanding Bollinger Bands signaling higher volatility. On the hourly timeframe, signs of a bullish crossover and hammer candlestick indicate a strong potential for near-term price appreciation. A positive Australian CPI print could act as a catalyst for further advances.Today’s Australian economic calendar at 03:30 GMT+1 features key Consumer Price Index data for March and Q1, with forecasts notably higher compared to previous readings: 4.7% y/y, 1.4% q/q, and 4.1% y/y. Should actual results beat expectations, this would provide fundamental support to the AUD and positively impact AUDUSD prices. Other scheduled international events present no direct significant influences on AUDUSD today.
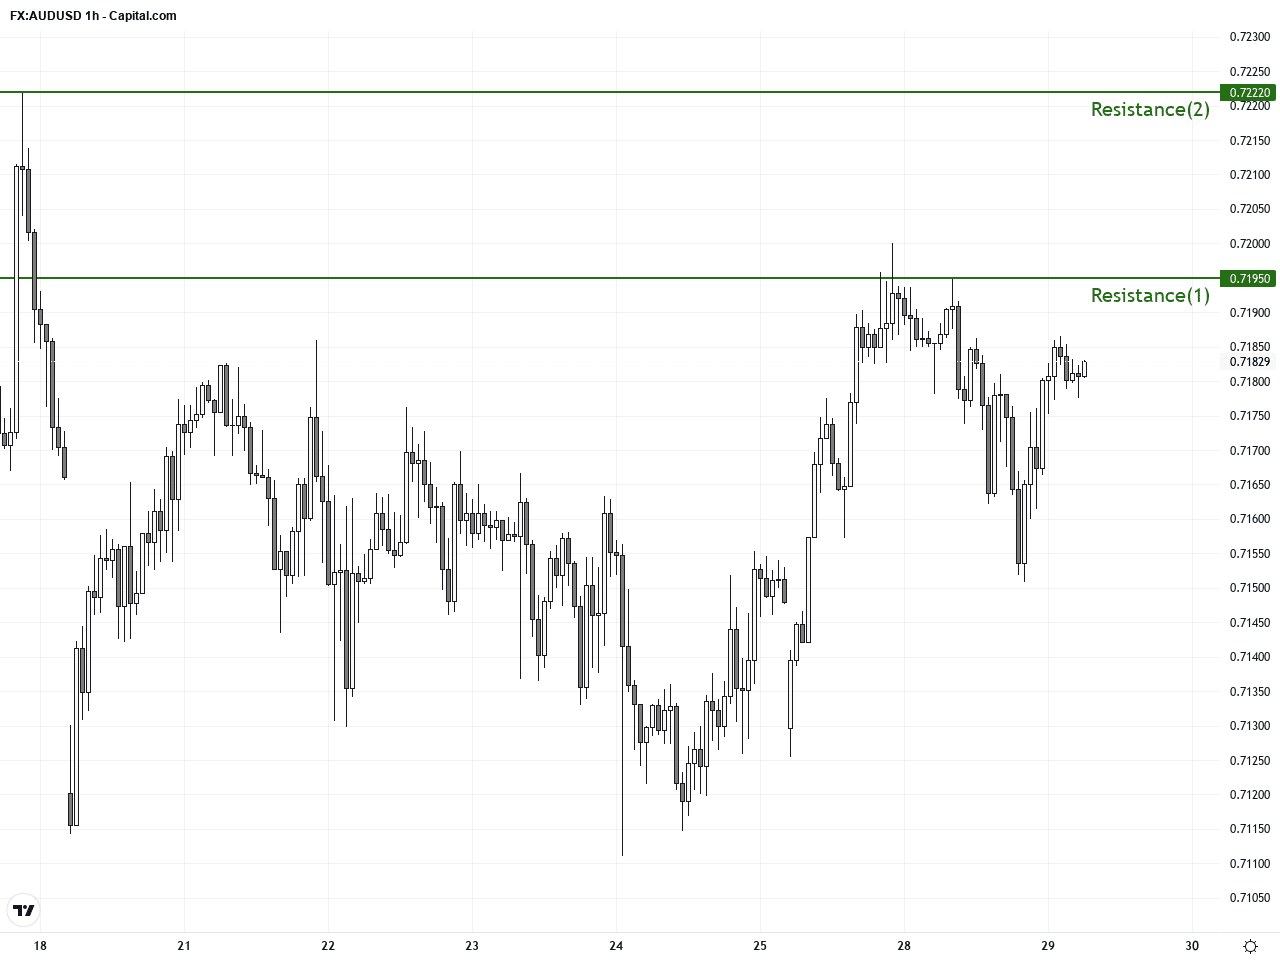
Resistance & Support
The above financial market data, quotes, charts, statistics, exchange rates, news, research, analysis, buy or sell ratings, financial education, and other information are for reference only. Before making any trades based on this information, you should consult independent professional advice to verify pricing data or obtain more detailed market information. 1uptick.com should not be regarded as soliciting any subscriber or visitor to execute any trade. You are solely responsible for all of your own trading decisions.