


 |
| Gold V.1.3.1 signal Telegram Channel (English) |

WTI Crude Oil: Key Volatility and Support-Resistance Levels in Light of Middle East Tensions, May 21, 2026
2026-05-21 @ 06:03
Over the past 24 to 48 hours, WTI crude oil prices experienced significant volatility, plunging from a closing price of $107.77 on May 19 to $98.26 on May 20, nearly a 9% drop. This sharp decline was mainly driven by ongoing tensions in the Middle East. Although initial hopes for a diplomatic breakthrough between the US and Iran temporarily eased oil prices, the lack of clear resolution kept prices under pressure.
According to the latest market news, the Middle East conflict remains the dominant factor driving the oil market. US President Trump’s renewed tough stance against Iran has heightened concerns over supply security. Furthermore, reports that three supertankers passed through the Strait of Hormuz briefly pushed prices down, reflecting optimism about a possible reopening of the crucial shipping route. Nevertheless, uncertainty around Middle East export channels continues to support prices, keeping WTI above key psychological levels even after slipping below $100.
For everyday investors, this highlights how geopolitical events can tangibly impact commodity prices. The rapid price drop is a reminder that instability in the Middle East remains a significant risk for the global energy market. Despite upbeat diplomatic news, fears over supply disruptions maintain high price volatility and elevate trading risk in the market.
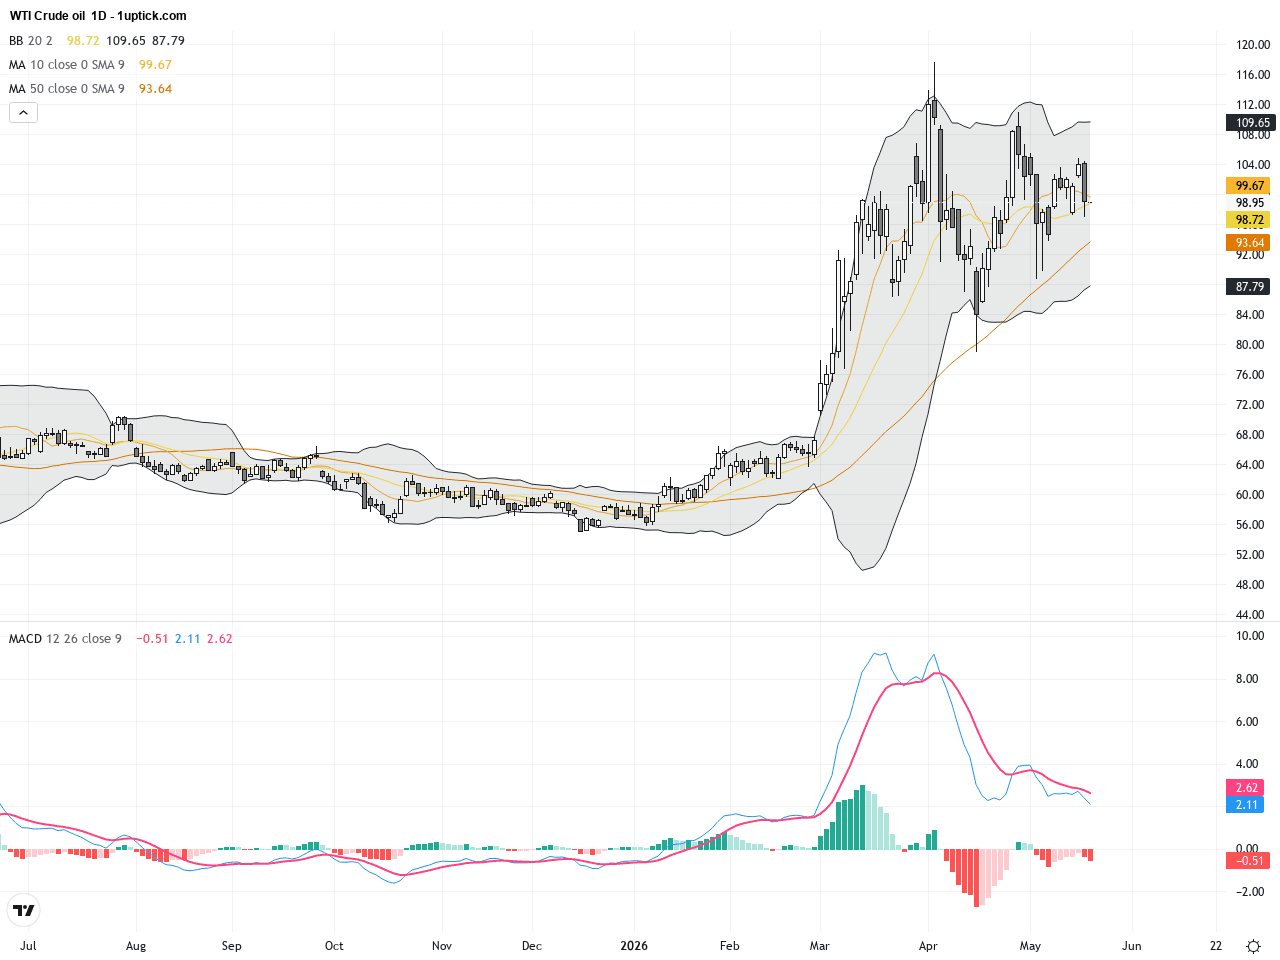
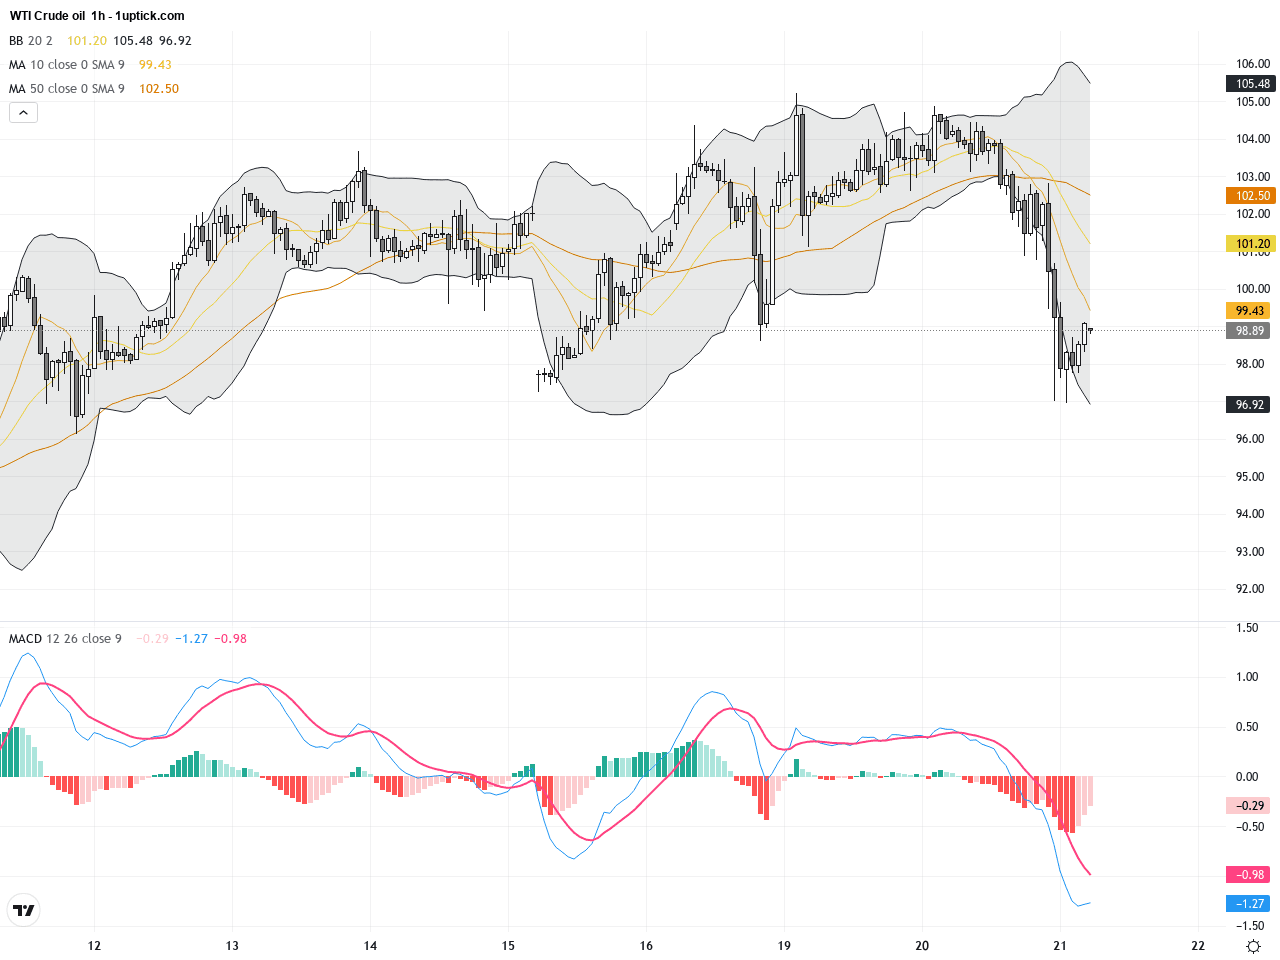
The daily chart shows WTI crude oil trending down from a high near $109 earlier this month. Moving averages are converging and starting to turn downward, signaling increasing medium-term bearish pressure. The Bollinger Bands indicate wide price swings with test of the lower band. The MACD recently formed a bearish crossover, confirming momentum to the downside. Overall, the daily trend is bearish as the price undergoes a significant corrective phase, awaiting testing of critical support levels before any meaningful rebound.
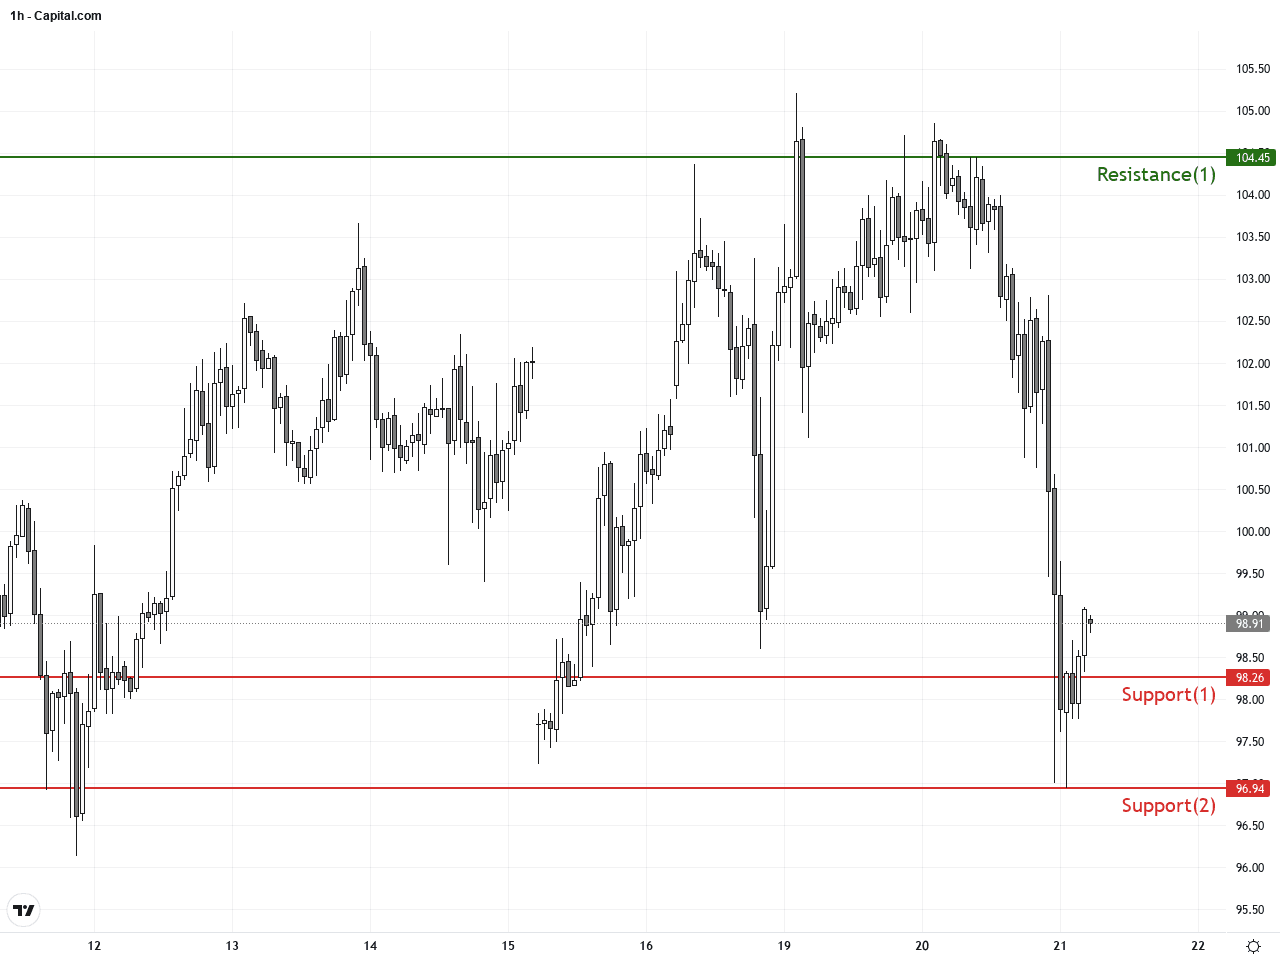
In the last 3-5 days, the hourly chart shows WTI struggling to break above resistance near $104. On May 20, prices broke below $100, hitting an intraday low of $96.94 before bouncing back. Short-term moving averages are turning down, while the MACD confirms growing bearish momentum. The RSI is near oversold levels, suggesting a short-term rebound may be due. Recent candlesticks formed doji-like patterns with upper and lower shadows, reflecting near-term indecision. The upcoming 24 hours will be crucial for identifying the next directional breakout.
Technical Trend: The current trend for WTI crude oil is a volatile correction phase characterized by medium-term bearish momentum and short-term consolidation with potential rebound attempts.
Key technical insights: The daily MACD bearish crossover and price slipping below key moving averages confirm medium-term downside pressure. However, the hourly RSI near oversold and recent doji candlesticks suggest a potential short-term pause or bounce. Traders should watch for clear price action around critical support and resistance zones to gauge momentum shifts. Caution is advised with positioning, using these technical cues to identify tactical trading opportunities.There are no significant or direct economic events scheduled today that are expected to impact WTI crude oil prices. Market focus remains on geopolitical developments in the Middle East and ongoing U.S. crude inventory reports. Traders should stay alert to any emerging news that could shift the market balance.
Resistance & Support
The above financial market data, quotes, charts, statistics, exchange rates, news, research, analysis, buy or sell ratings, financial education, and other information are for reference only. Before making any trades based on this information, you should consult independent professional advice to verify pricing data or obtain more detailed market information. 1uptick.com should not be regarded as soliciting any subscriber or visitor to execute any trade. You are solely responsible for all of your own trading decisions.