


 |
| Gold V.1.3.1 signal Telegram Channel (English) |

AUDUSD: Aussie Dollar Holds Above Key Support Amid Bullish Technical Patterns, May 22, 2026
2026-05-22 @ 06:01
Over the past 24 to 48 hours, the AUD/USD currency pair has exhibited notable volatility, closing recently at 0.71466, slightly down from the previous day’s 0.71551. As the market awaits Australia’s latest employment data, price action remains range-bound, with investors carefully monitoring how this report might influence expectations for the Reserve Bank of Australia’s policy stance.
The market has been influenced by a sharp rise in US Treasury yields, driven by stronger-than-expected US economic data and hawkish repricing of the Federal Reserve, which has weakened support for safe-haven assets like gold. This dynamic contributes some uncertainty to the US dollar and, by extension, the AUD/USD pair.
Additionally, geopolitical and political risks such as tensions in Iran and the Middle East, alongside President Trump’s assertive trade rhetoric, have exerted short-term pressure on market sentiment. Yet, resilient inflation data from Australia combined with the RBA’s cautious but hawkish tone have helped the Aussie maintain relative strength amid these complex influences.
For the average investor, recent AUD/USD movements resemble a ship steadying itself through turbulent waters: despite external uncertainties and macro risks, the market finds temporary support amid key economic data and central bank signals, standing by for a clearer trend to emerge.
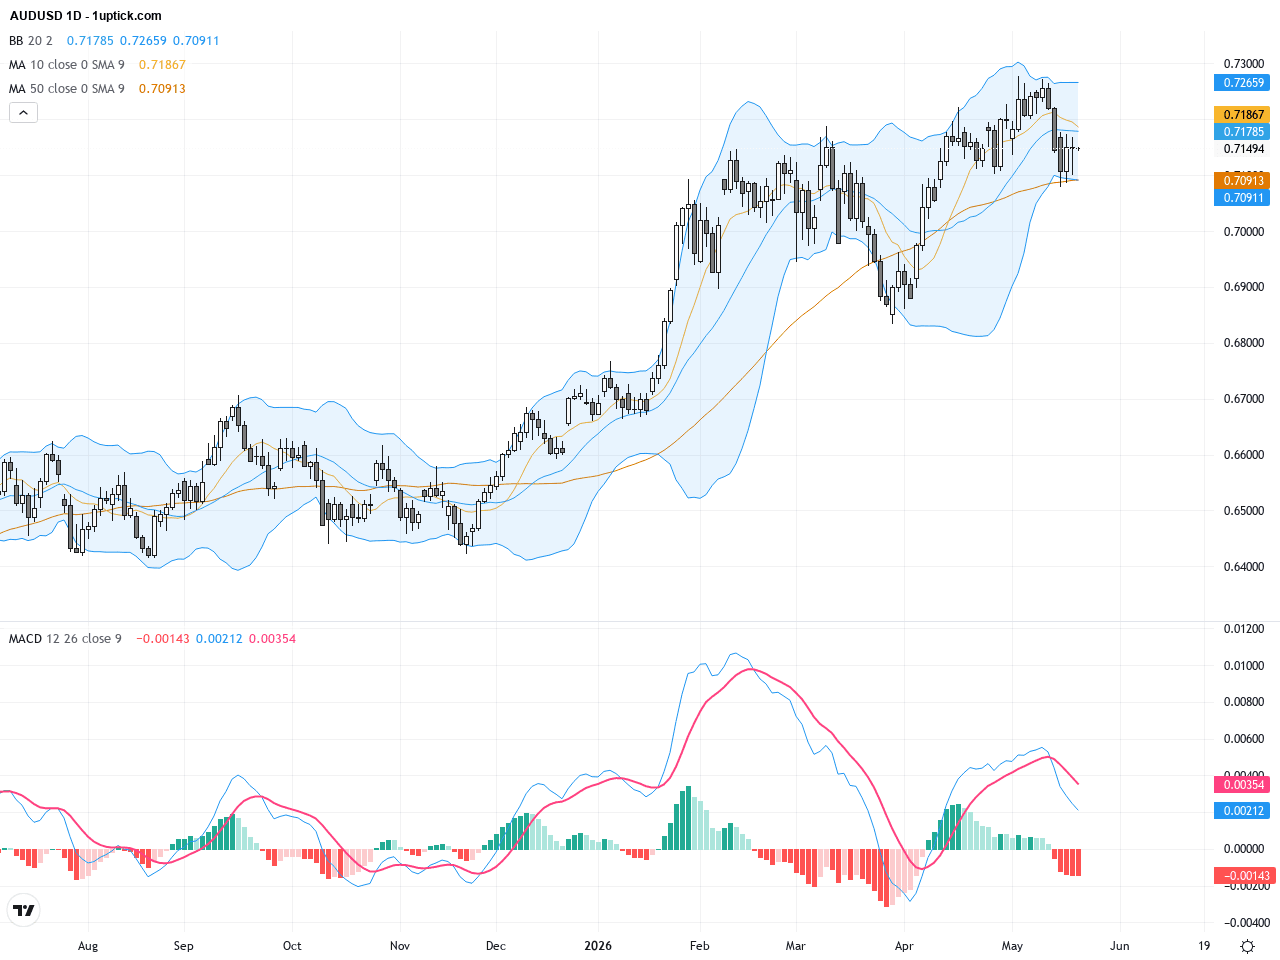
The daily chart shows AUDUSD consolidating between 0.68 and 0.72 in recent weeks, with a recent breakout above the key 0.7100 support zone. The price remains above both the 50-day (around 0.7090) and 200-day moving averages (around 0.6776), indicating a medium-to-long term bullish trend. Bollinger Bands have started to widen, signaling increased volatility. The MACD remains in positive territory with a bullish crossover, reflecting strengthening buying momentum and suggesting further upward potential.
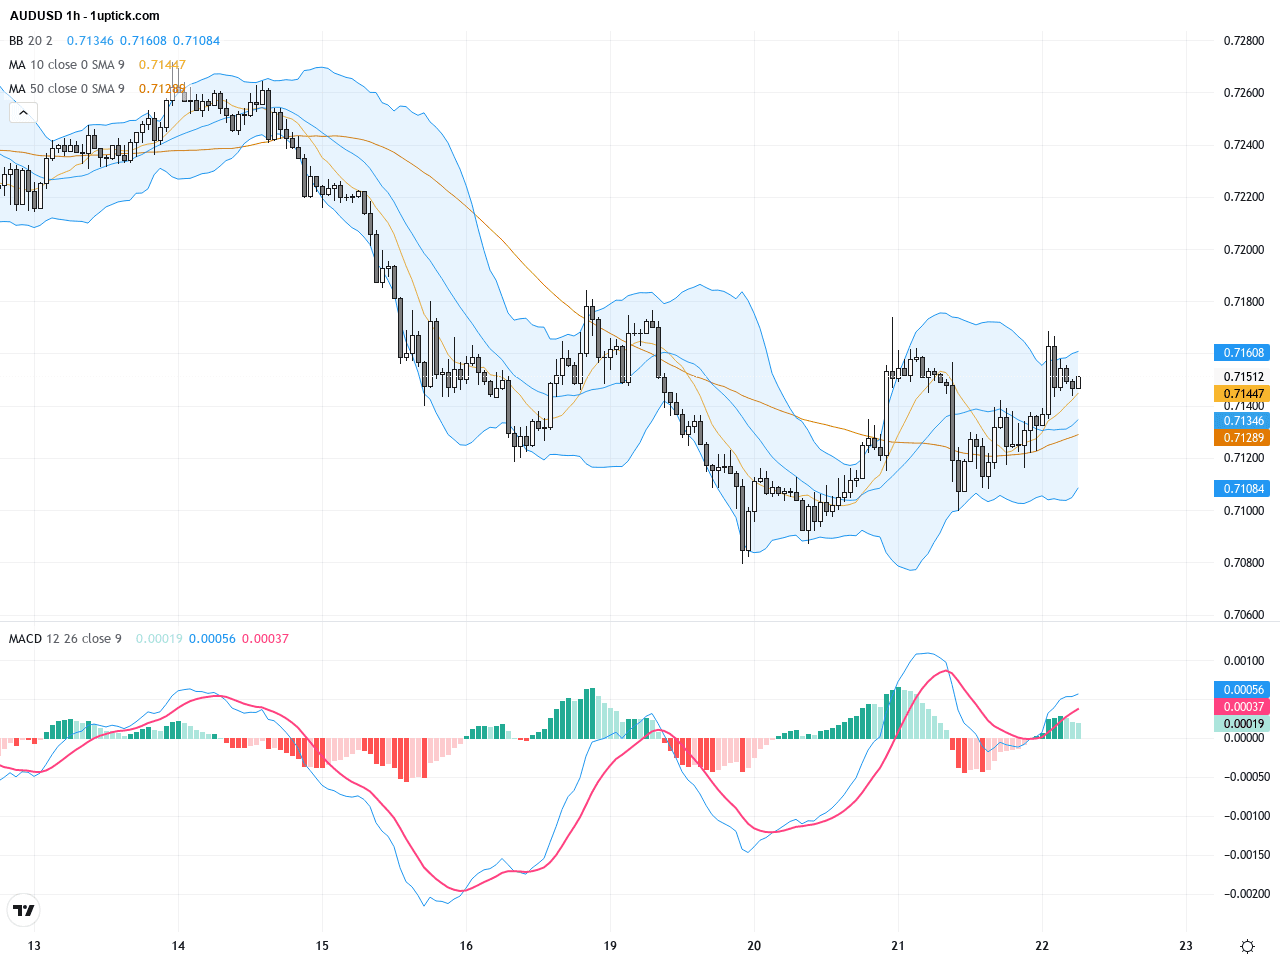
The hourly chart over the last 3-5 days displays AUDUSD oscillating between 0.7120 and 0.7170 while completing a corrective breakout followed by a rebound. Short-term moving averages (5 & 20 period) form a golden cross and the middle Bollinger Band acts as support, helping price hold elevated levels. MACD histogram has turned positive, pointing to rapidly improving short-term momentum. A recent bullish engulfing candlestick pattern signals strong buying pressure in the near term, supporting further gains over the next 24 hours.
Technical Trend: Overall trend is firmly bullish, currently in a cautiously optimistic phase. Price is likely to extend gains but remain wary of possible retracements triggered by upcoming economic data releases. Risk management remains key.
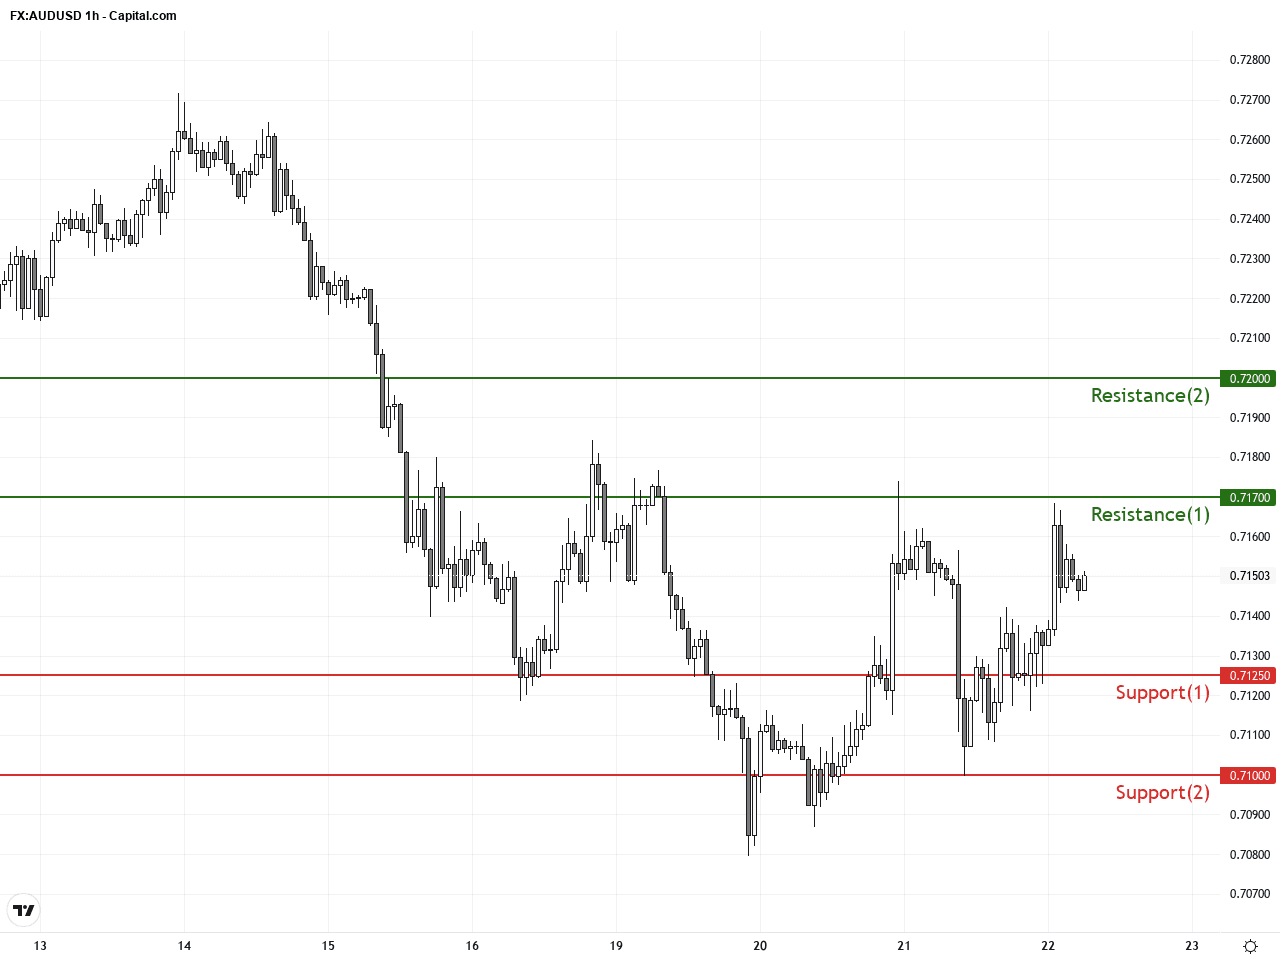
Technically, AUDUSD is in a decisive bullish phase with the daily MACD rising in positive territory confirming a steady uptrend. The hourly chart presents a golden cross and strong bullish engulfing candlestick, highlighting renewed buying momentum. Volume remains stable but prices breaking above 0.7150 have turned former resistance into support. This sets the stage for potential challenges of the 0.7200 resistance. Traders should watch MACD continuity and Bollinger Band expansion for confirmation of sustainable moves.Today’s economic calendar highlights Australian April employment data as the most relevant event for AUDUSD. The unemployment rate rose to 4.5%, while employment declined by 18,600 jobs, suggesting labor market softening that could pressure the Aussie in the short term. Additionally, New Zealand and Japan posted stronger-than-expected trade balance figures, which, while not directly impacting AUDUSD, may influence regional currency sentiment. Overall, weaker Australian employment data may introduce some downside risk to AUDUSD momentum; traders should monitor closely.
Resistance & Support
The above financial market data, quotes, charts, statistics, exchange rates, news, research, analysis, buy or sell ratings, financial education, and other information are for reference only. Before making any trades based on this information, you should consult independent professional advice to verify pricing data or obtain more detailed market information. 1uptick.com should not be regarded as soliciting any subscriber or visitor to execute any trade. You are solely responsible for all of your own trading decisions.