








 |
| Gold V.1.3.1 signal Telegram Channel (English) |
XAUUSD Technical and Fundamental Analysis: Gold Stuck Below $4000 Resistance Amid Rising Treasury Yields, July 21, 2026
2026-07-21 @ 05:04
Over the past 24 to 48 hours, gold (XAUUSD) has shown a relatively volatile performance, closing yesterday at 4007.87 USD, hovering near the crucial 4000 USD level. The market’s focus remains on a strong US dollar and rising Treasury yields, which have put downward pressure on gold prices, preventing a breakthrough above the resistance range of 4020 to 4040 USD.
The latest market news highlights that although tailwinds like cooler-than-expected US inflation data briefly boosted gold, hawkish comments from Federal Reserve officials such as Powell and ongoing geopolitical tensions have created a tug of war. Investors are witnessing a scenario where gold’s upside is capped as it contends with a stronger dollar and climbing bond yields, resulting in restrained recovery moves.
In simple terms for everyday investors, the recent gold price action can be likened to attempting to climb a high wall against a strong wind: demand for gold remains supported due to geopolitical uncertainties and safe-haven interest, but broader macroeconomic conditions and interest rate outlooks significantly dampen momentum. As a result, prices are realistically confined to a range-bound pattern for now. Market participants should closely monitor upcoming Fed decisions and dollar trends, which will be pivotal in determining gold’s next directional move.
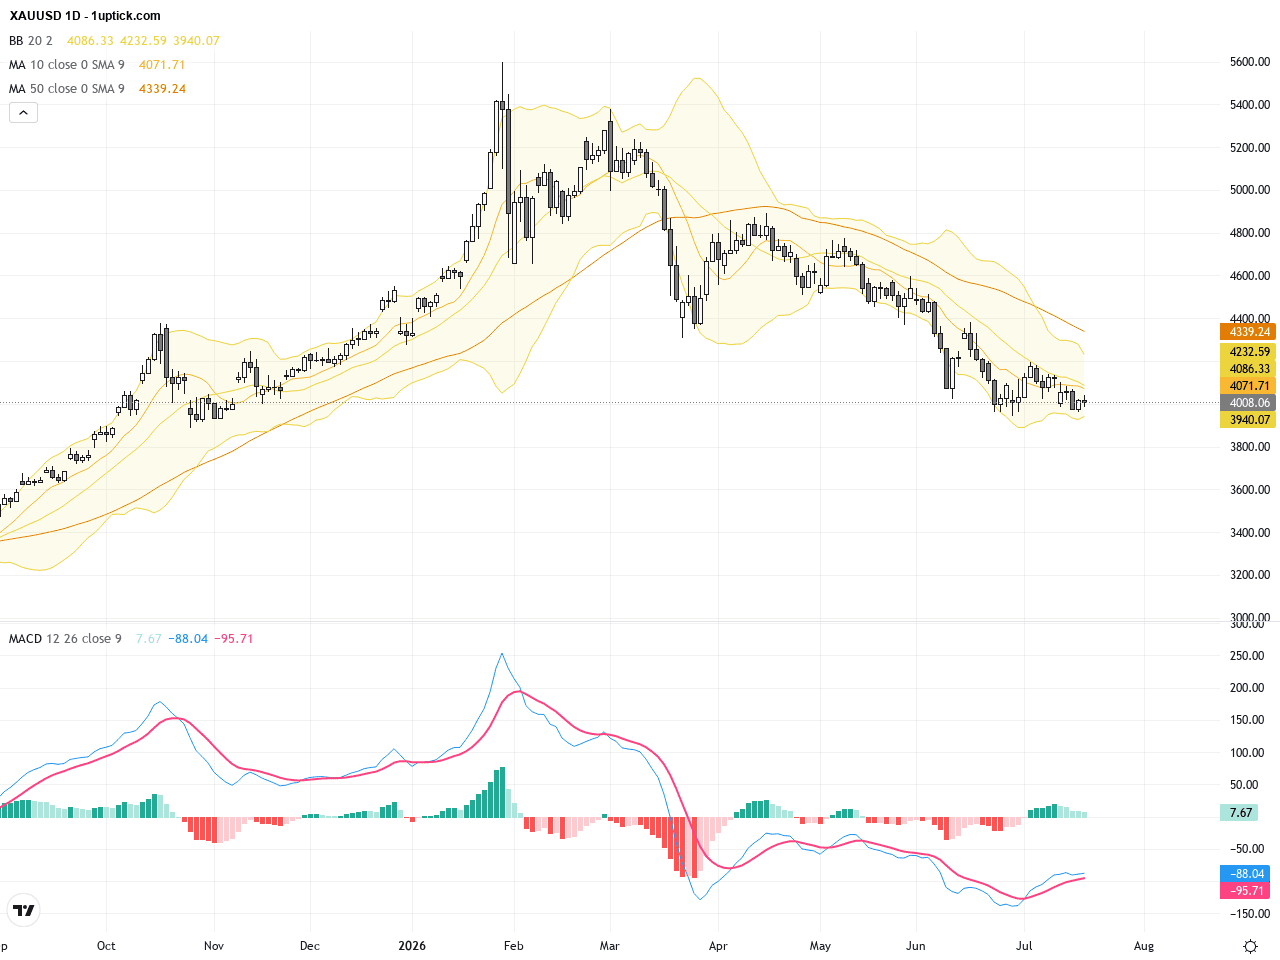
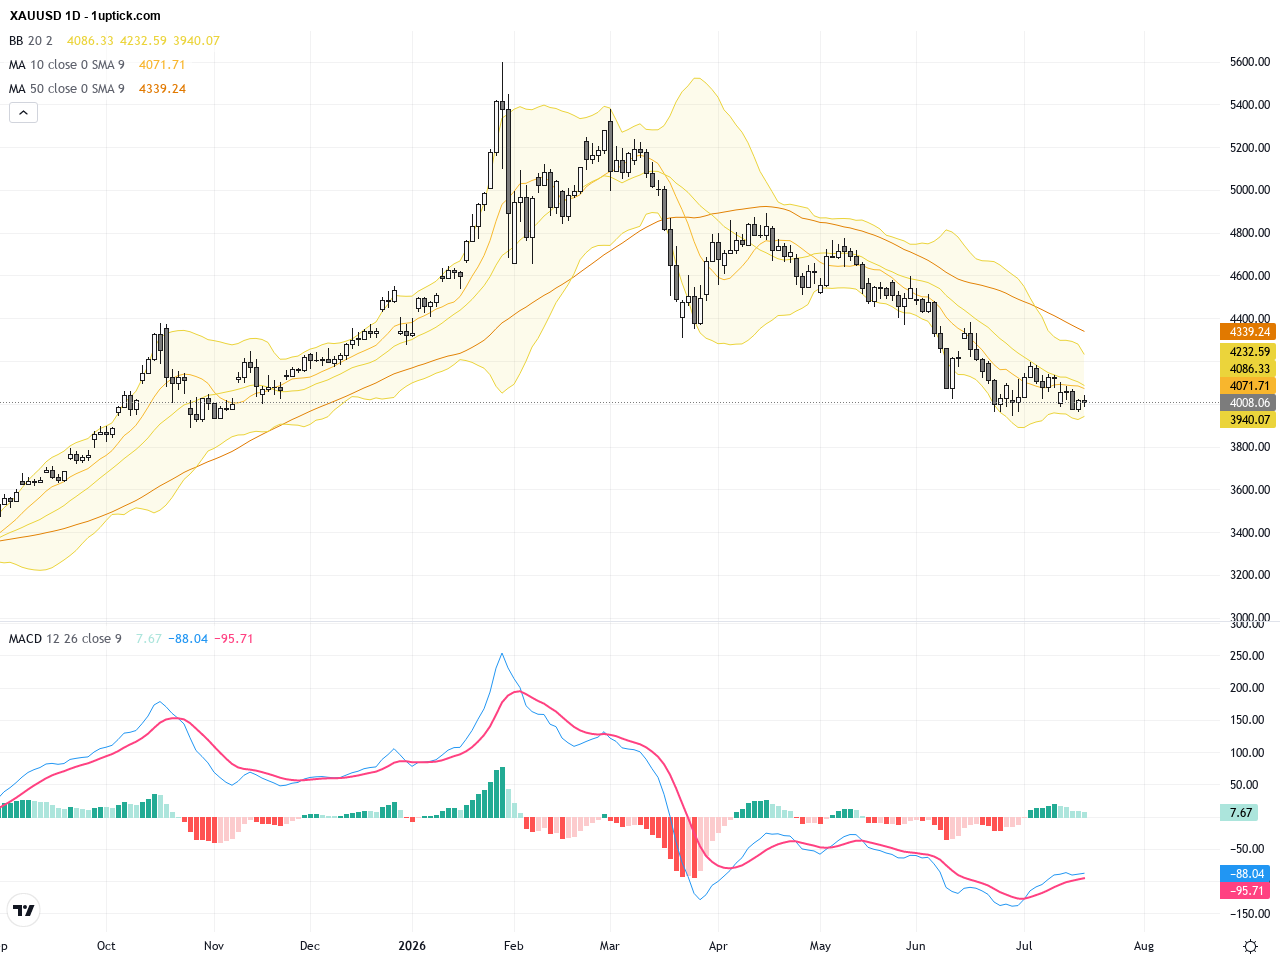
The daily chart shows XAUUSD trending downward over the past week, declining from the early July highs near $4175 to hovering around the $4000 mark. Medium-term moving averages like the 50-day and 100-day are flattening near price levels, indicating lack of strong trend momentum. Bollinger Bands are tightening, suggesting reduced volatility, but the upper band resistance between $4020 and $4040 remains intact. The MACD indicator reflects weakening bullish momentum, with the signal lines contracting, pointing to continued consolidation. Overall, the daily time frame technical outlook is neutral to slightly bearish, emphasizing a consolidation phase.
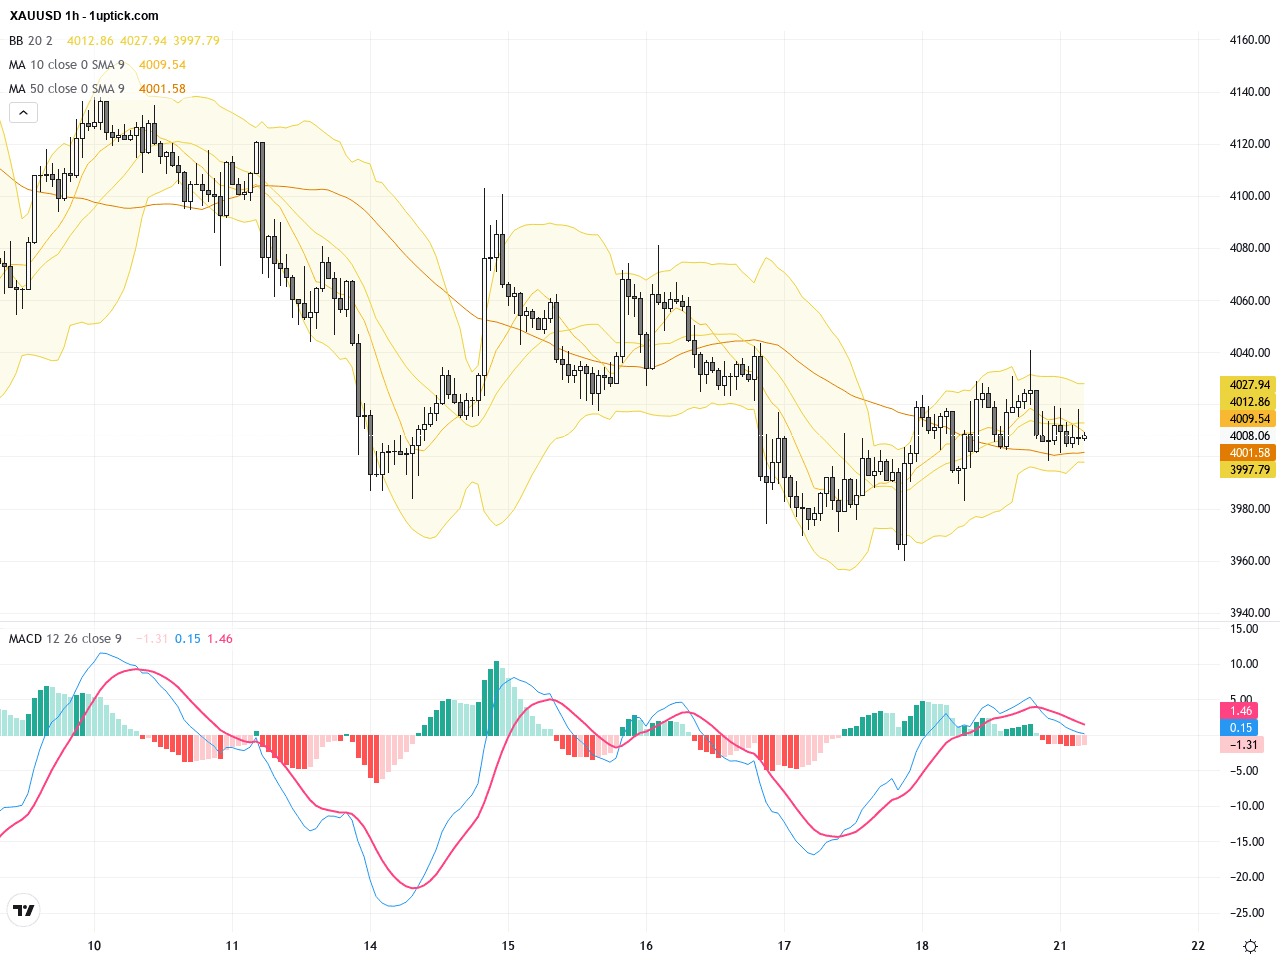
The hourly chart over the last 3 to 5 days illustrates multiple tests of the $4000 support level with minor rebounds, but no sustained breakout past the key resistance around $4030. Short-term moving averages are intertwined with little directional bias, highlighting short-term volatility and indecision. Bollinger Bands have moderately widened, indicating an uptick in volatility. The MACD recently formed a minor bearish crossover near the zero line, suggesting weakened short-term bullish momentum. This setup may be forming a flag or triangle consolidation pattern, awaiting a decisive breakout to set the next direction.
Technical Trend: The current gold price action is best described as cautious consolidation with neither strong bullish nor bearish trend dominance.
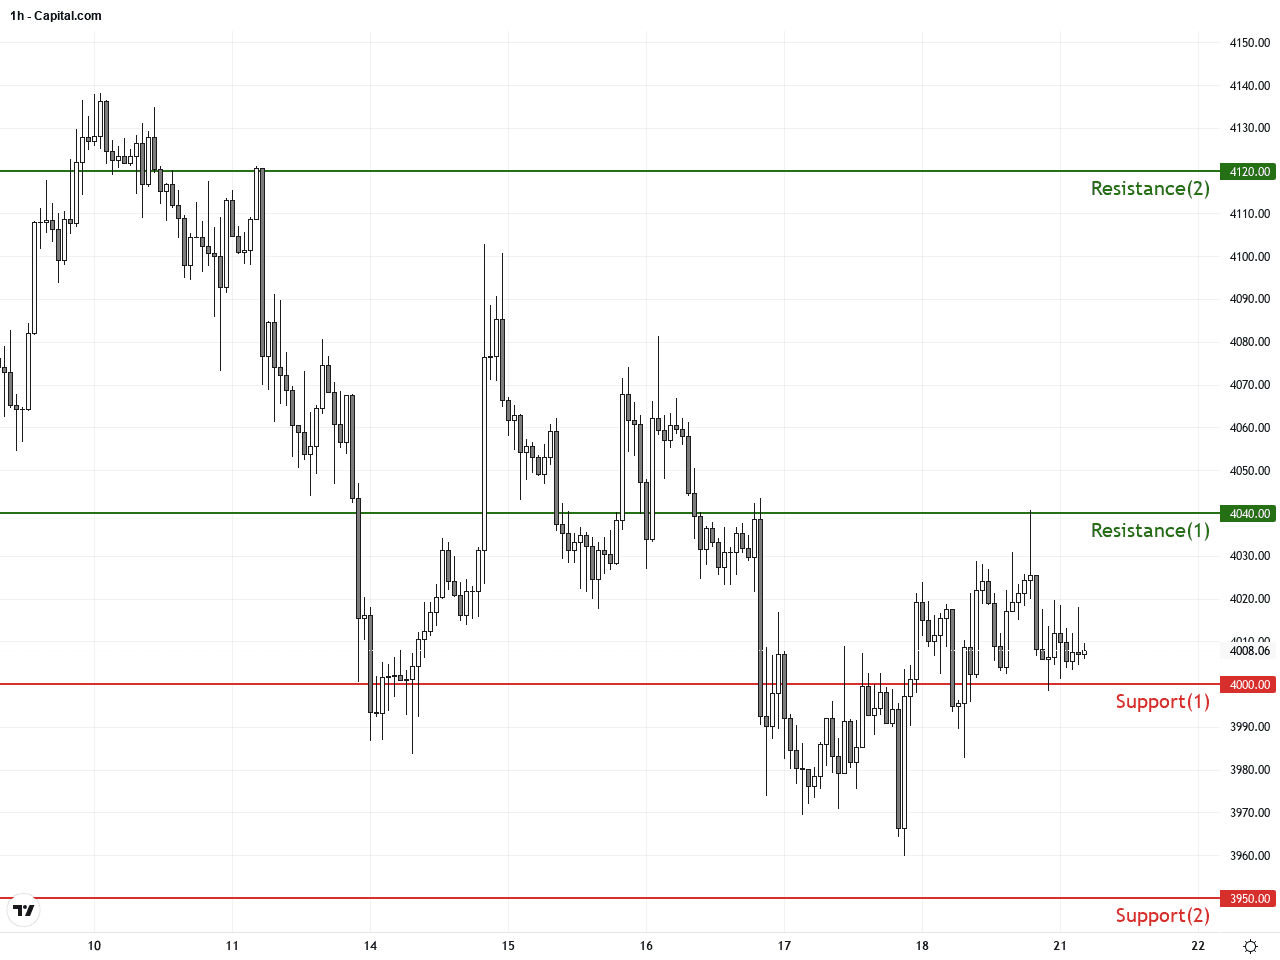
Key technical observations highlight a coexisting downtrend and consolidation on the daily chart with prominent resistance near $4020-$4040 that repeatedly caps upside attempts. The hourly chart’s MACD bearish crossover alongside expanding Bollinger Bands signals increasing short-term selling pressure. A break below $4000 could trigger further downside momentum. Conversely, recent hammer candles with long lower shadows suggest robust support and the possibility of short-term rebounds. Traders should watch for clear breakout signals either above resistance or below support to confirm next directional moves.Today’s economic calendar does not feature any major US or dollar-centric events directly impacting XAUUSD. The notable releases include Canada’s CPI and core CPI data at 14:30 GMT+1 and the US Conference Board Leading Indicators at 16:00 GMT+1. Should these figures deviate significantly from forecasts, indirect impacts on the US dollar and thereby gold prices are possible. Overall, no immediate major economic events are expected to alter gold’s short-term trajectory today, so traders should stay alert to geopolitical developments and technical signals.
Resistance & Support
The above financial market data, quotes, charts, statistics, exchange rates, news, research, analysis, buy or sell ratings, financial education, and other information are for reference only. Before making any trades based on this information, you should consult independent professional advice to verify pricing data or obtain more detailed market information. 1uptick.com should not be regarded as soliciting any subscriber or visitor to execute any trade. You are solely responsible for all of your own trading decisions.