









 |
| Gold V.1.3.1 signal Telegram Channel (English) |
WTI Crude Oil: Prices Retreat to Three-Week Low Amid Key Technical Support Test, August 4, 2026
2026-08-04 @ 06:03
Over the past 24 to 48 hours, WTI crude oil prices have shown notable volatility, closing from $80.34 the previous day to approximately $78, representing a sharp decline. This move was mainly driven by recent U.S. political developments, particularly President Trump’s cancellation of a planned attack on Iran, which quickly shifted market sentiment to reduce geopolitical risk premiums on oil prices.
In addition, latest market news indicates that U.S. oil exports in July dropped to the lowest level in eight months, adding supply-side pressure to the market. As a result, oil prices plunged 7% to hit a three-week low. These factors combined caused investors to take a cautious stance on crude demand outlook. However, equities rallied amid eased inflation worries thanks to declining oil prices, pushing the U.S. stock market near record highs, reflecting a reallocation of risk assets.
For average investors, the recent volatility in oil prices highlights how geopolitical and macroeconomic events directly impact the market. When risk appetite deteriorates, oil prices tend to fall, indirectly affecting energy-related equities and investment values in the oil and gas sector. Going forward, closely monitoring international political developments and U.S. export data will be essential to gauge crude oil price trends.
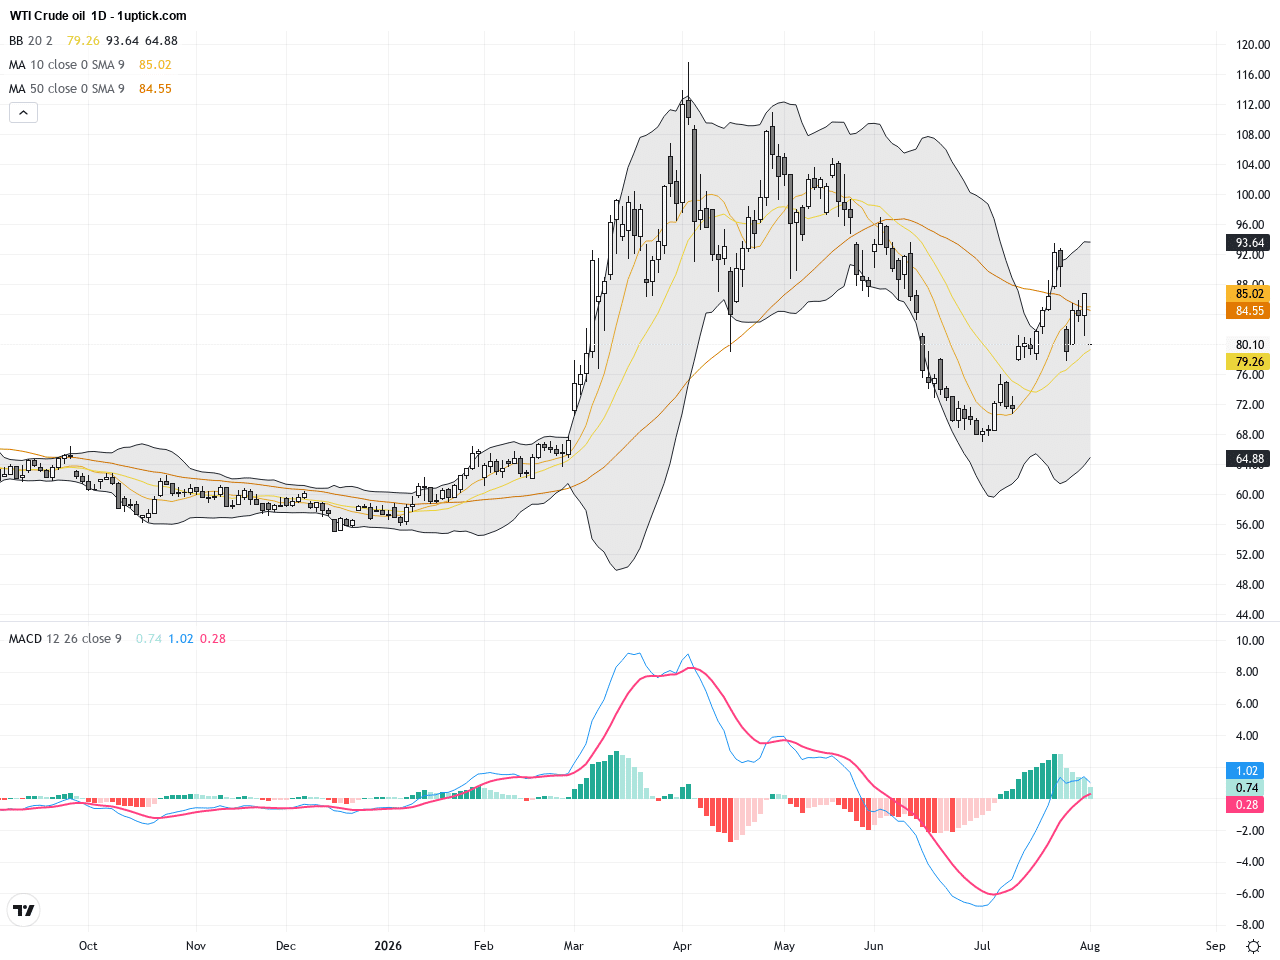
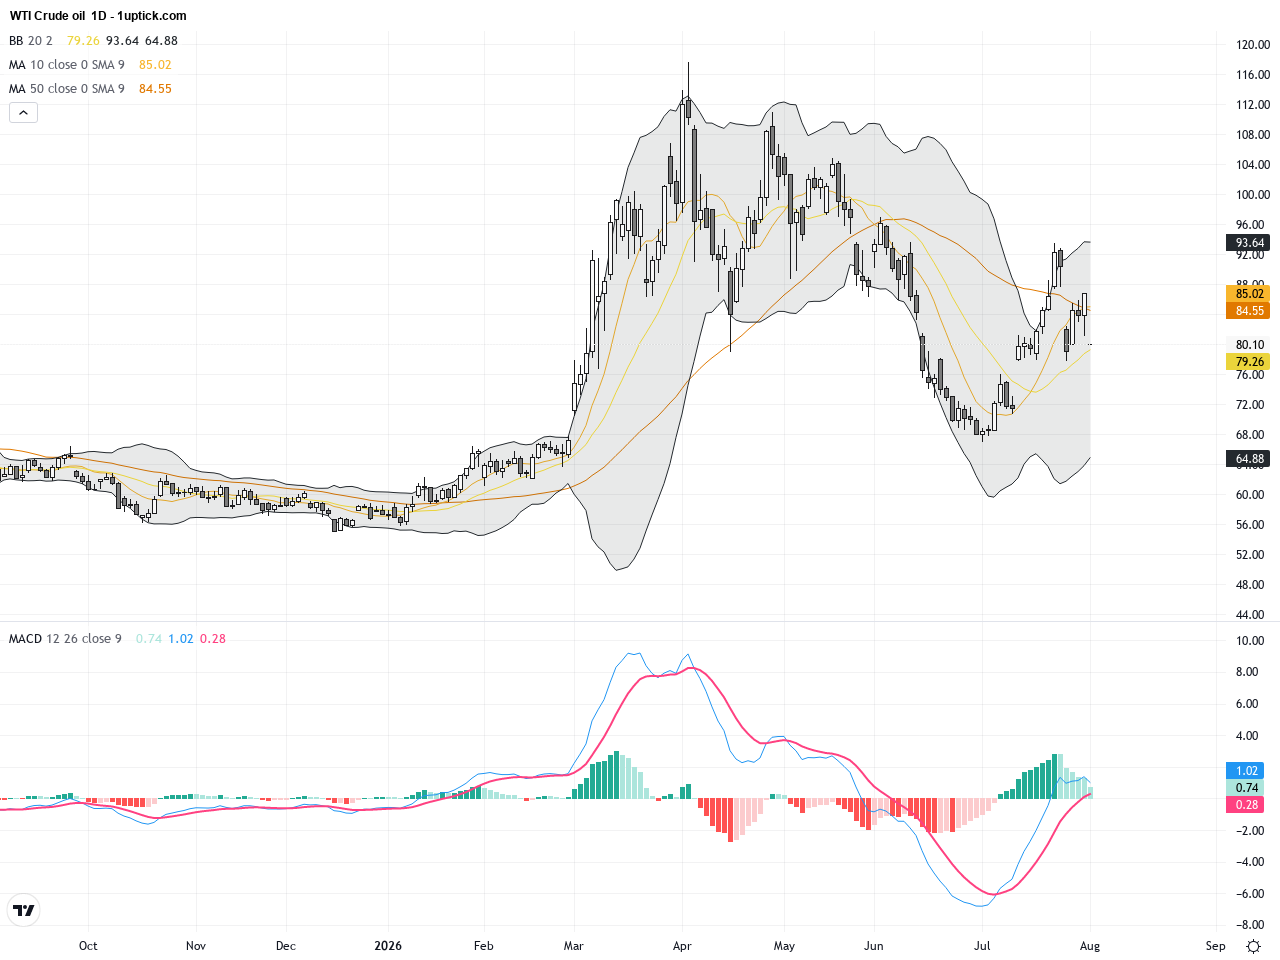
The daily chart shows WTI Crude Oil steadily declining from late July highs around $84.67, forming a clear corrective phase. Price action is currently testing the 200-day exponential moving average near the $79 region, signaling underlying medium-to-long term support. Bollinger Bands reveal the price crossing below the midline with expanding volatility, and the MACD remains in negative territory with a bearish crossover, indicating sustained selling pressure and a consolidative downward trend overall.
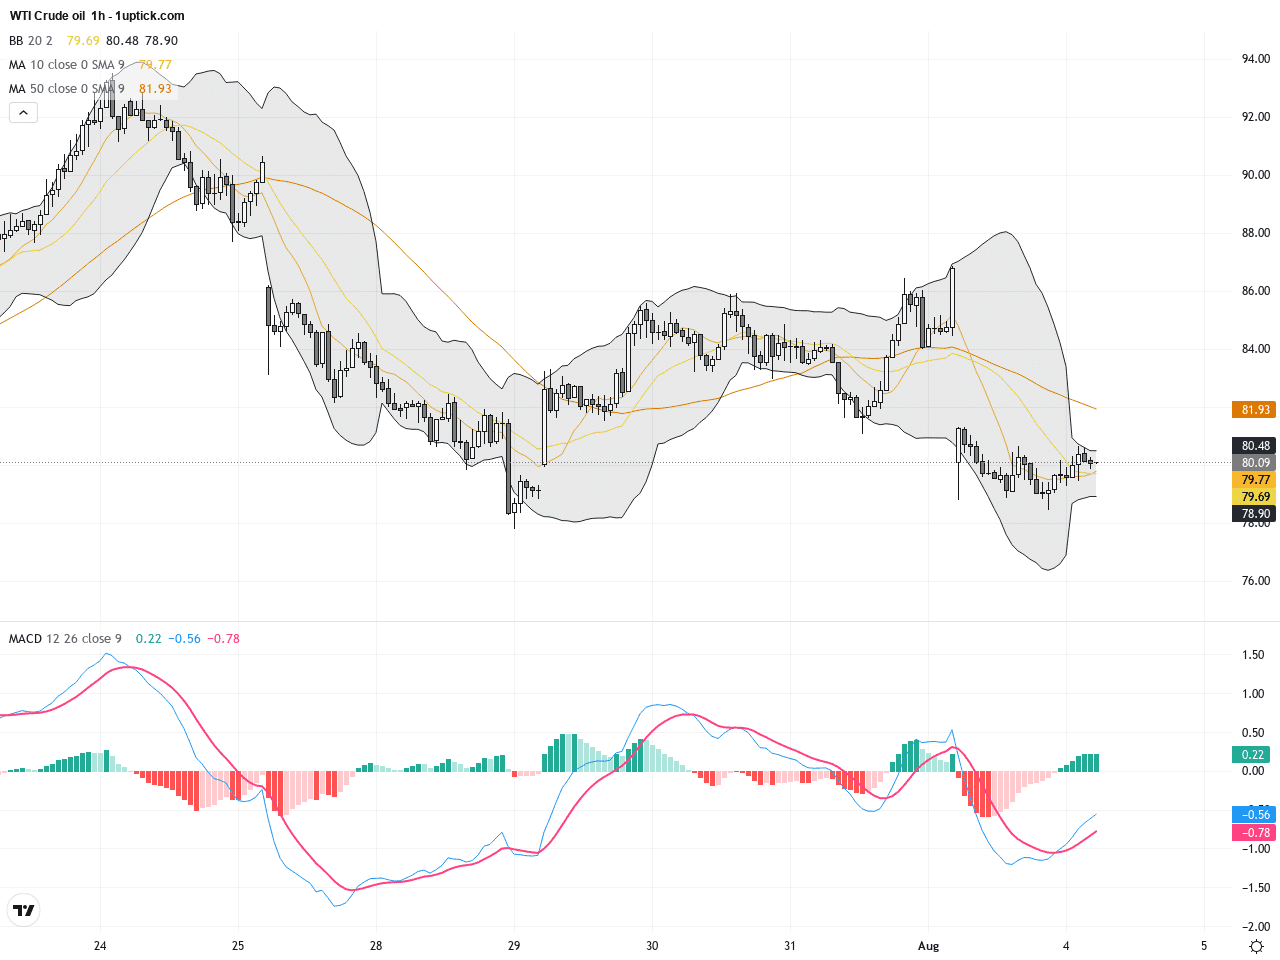
The hourly chart over the last 3-5 days reveals an initial swift decline followed by sideways price action oscillating between $80 and $78. Short-term moving averages frequently cross downward, and the Bollinger Bands are narrowing, indicating a contraction in volatility. A recent engulfing candlestick pattern suggests a potential short-term rebound, though momentum remains limited. Overall, the hourly view points to a volatile sideways consolidation awaiting a directional break.
Technical Trend: WTI Crude Oil is currently in a volatile sideways consolidation with a cautious bearish undertone.
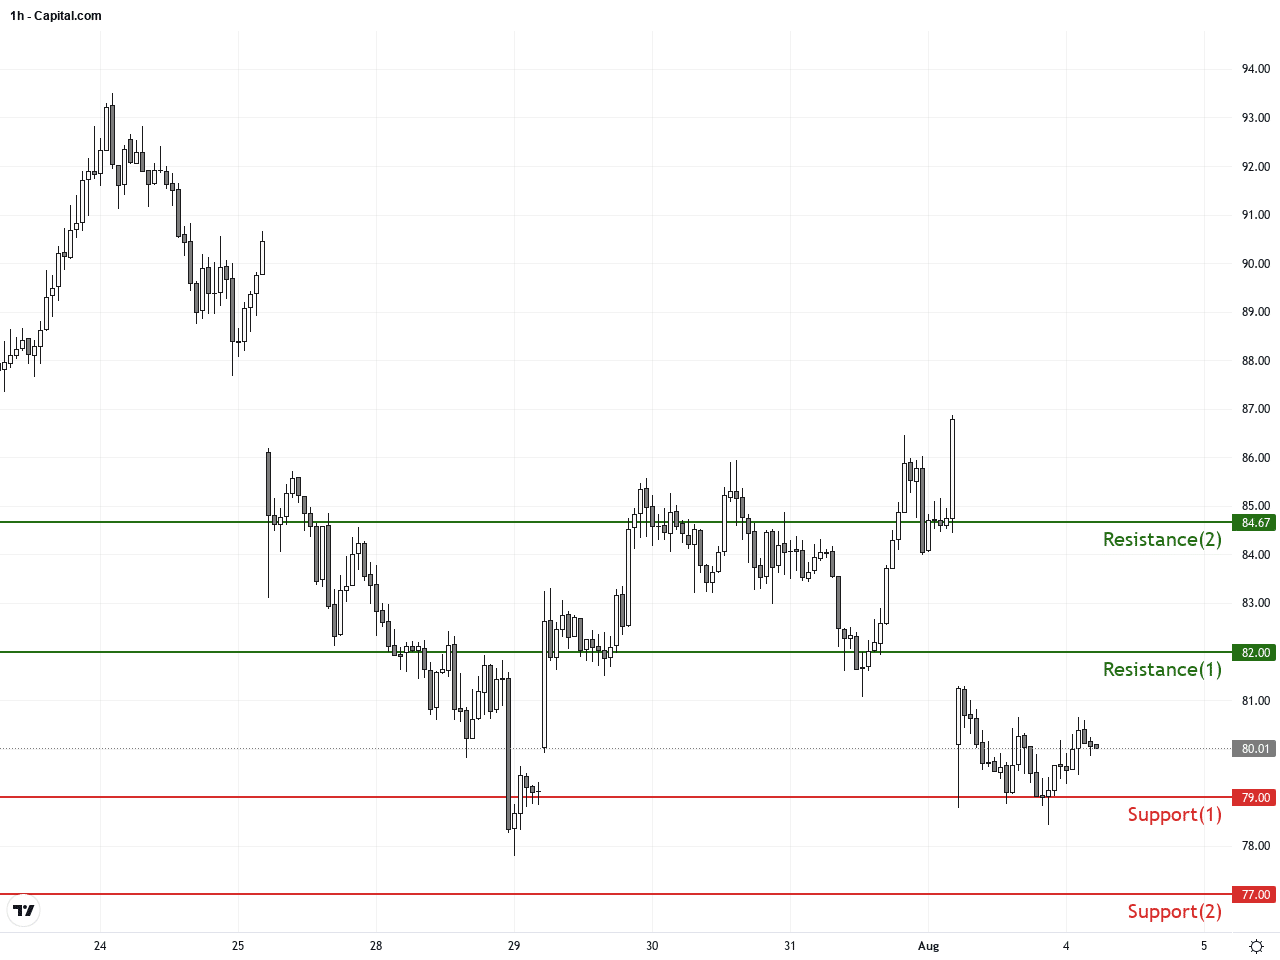
Technically, WTI is holding a key support zone around its 200-day EMA near $79. A sustained hold here might trigger a bounce, but traders should heed the bearish MACD crossover and widened Bollinger Bands on the daily chart, which hint at continuing downward risk. The hourly engulfing pattern and downward-sloping short-term moving averages suggest cautious short-term optimism but overall bearish bias. Monitoring breakouts or breakdowns from these levels will provide high-probability trade setups.There are no significant or directly relevant economic events scheduled today that would impact WTI Crude Oil prices. Traders should continue focusing on supply-demand fundamentals and geopolitical news flow for near-term price drivers.
Resistance & Support
Run Live WTI Crude Oil Analysis
The above financial market data, quotes, charts, statistics, exchange rates, news, research, analysis, buy or sell ratings, financial education, and other information are for reference only. Before making any trades based on this information, you should consult independent professional advice to verify pricing data or obtain more detailed market information. 1uptick.com should not be regarded as soliciting any subscriber or visitor to execute any trade. You are solely responsible for all of your own trading decisions.