









 |
| Gold V.1.3.1 signal Telegram Channel (English) |
XAUUSD Technical Breakout Signals Bullish Trading Outlook Amid Gold Surge, August 6, 2026
2026-08-06 @ 05:04
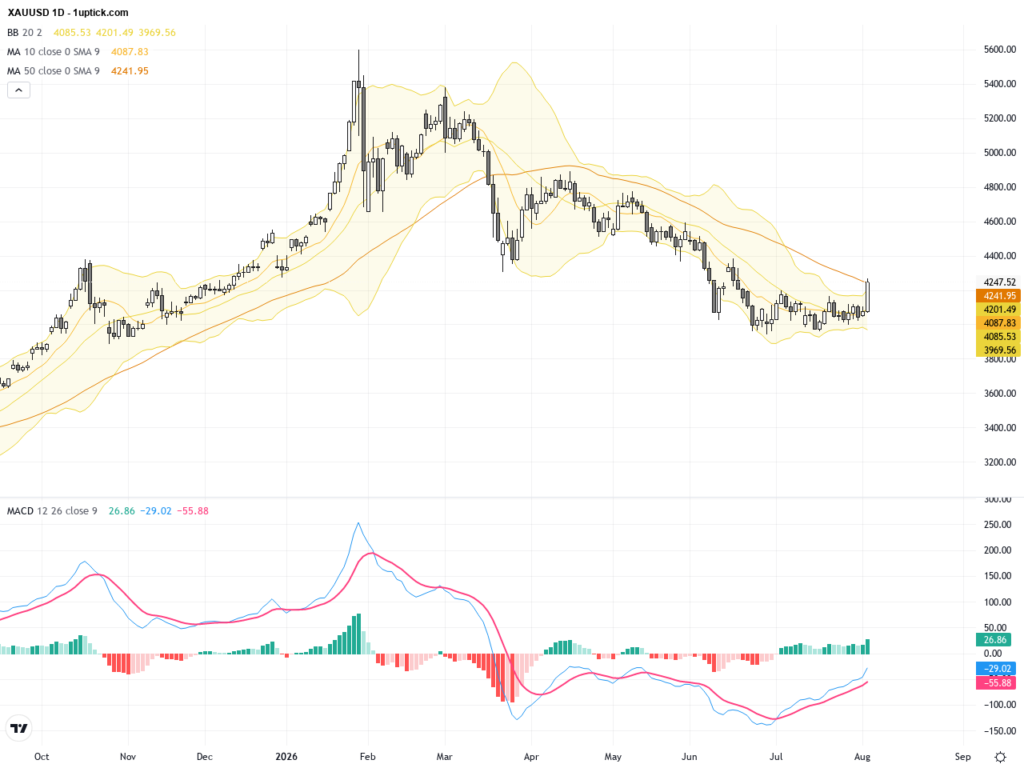
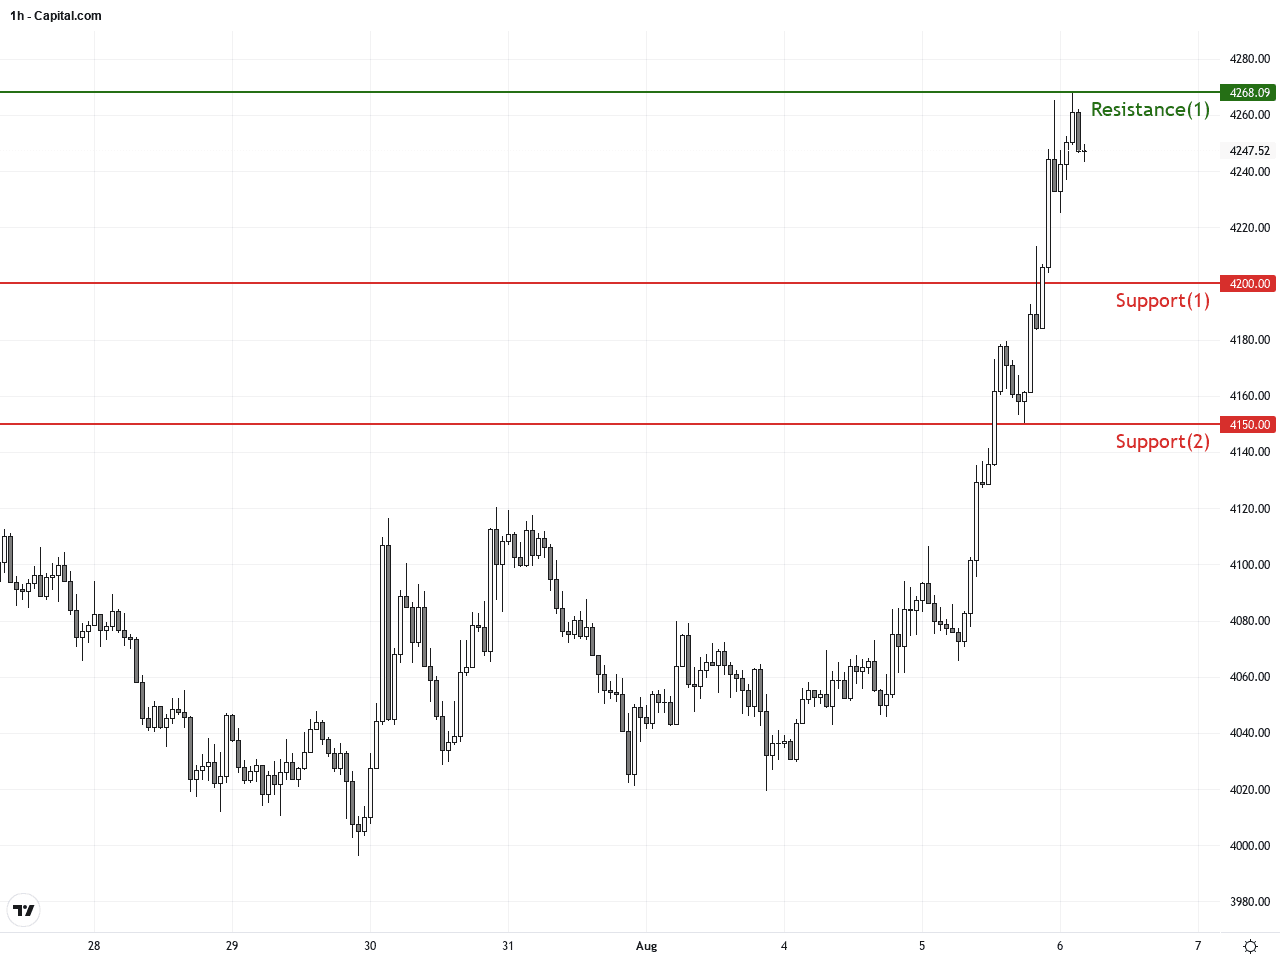
Over the past 48 hours, gold (XAUUSD) has experienced a significant uptick, rallying above yesterday’s closing price of 4244.2 to reach a high of 4268.09, marking its strongest level in over a month. This surge was driven by a surprising market shift as easing energy inflation fears renewed optimism that the Federal Reserve may hold back on further rate hikes, fueling safe-haven buying interest in gold.
Recent headlines such as “Gold and Silver Break Out as Market Makes Surprise Shift” and “Gold News: XAUUSD Price Soars as Iran Talks Cut Oil and Rate-Hike Odds” highlight key drivers behind the rally. The ongoing talks between the U.S. and Iran have contributed to a drop in oil prices and a dampening of rate hike expectations. Coupled with a weaker dollar and lower yields, gold broke above its 50-day moving average with a strong upward momentum.
For the average investor, this price movement illustrates how geopolitical developments and eased inflation pressures from energy stabilize the outlook, reducing the likelihood of aggressive Fed moves. Gold, as a traditional safe haven, attracted inflows amid this landscape, pushing prices notably higher recently. Investors should keep a close eye on geopolitical and macroeconomic updates as these factors will continue to influence gold’s trajectory in the near term.

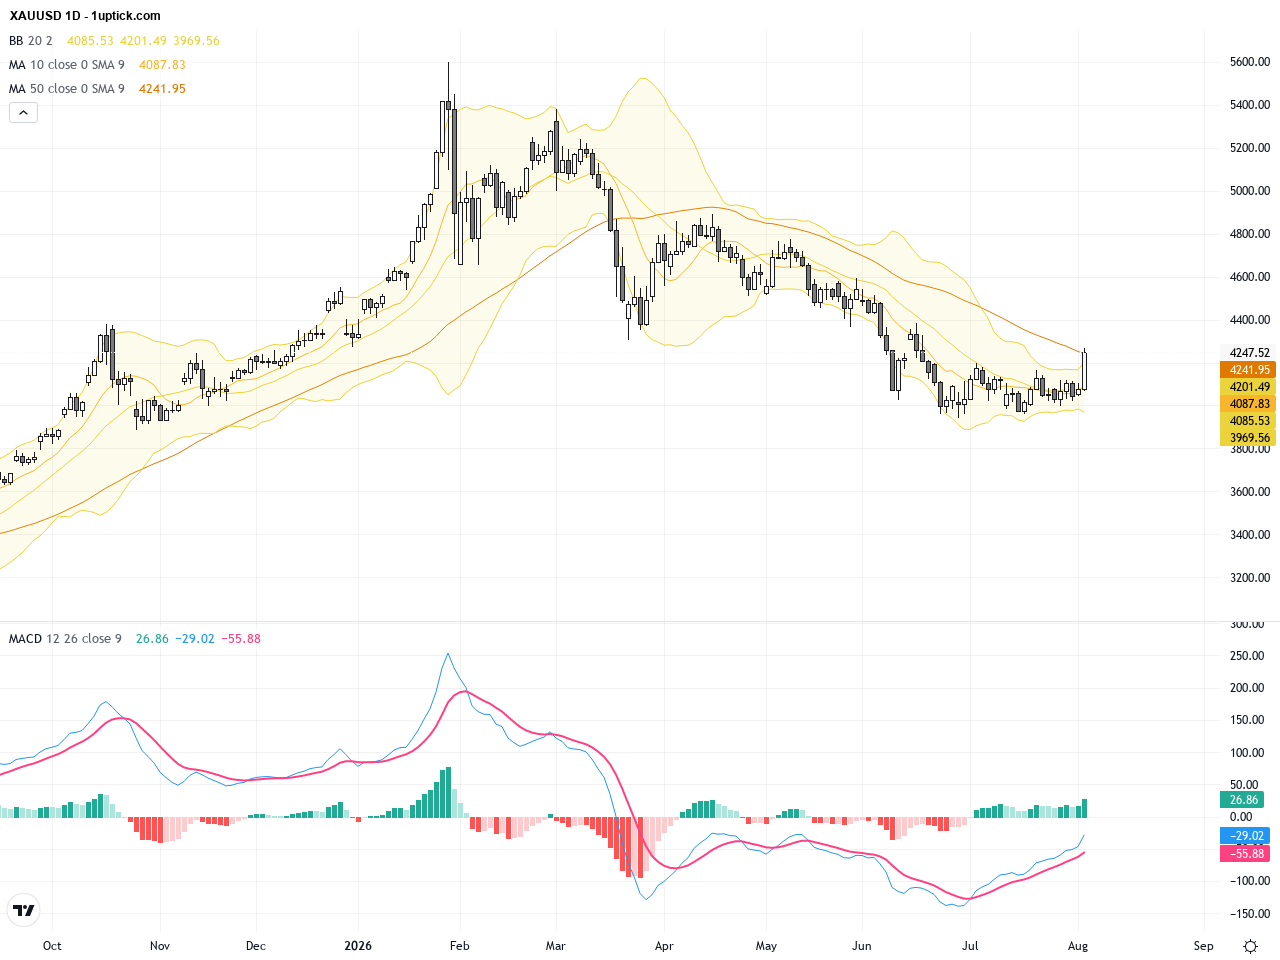
The daily chart highlights a strong recovery from lows near 4020, with gold breaking above the 50-day moving average (~4150) and pushing above the Bollinger Bands middle band, signaling a bullish uptrend. The MACD indicator turned positive with the fast line diverging upwards, confirming growing bullish momentum. Overall, the trend favors long positions following a breakout from a consolidation zone and a clear rebound pattern.
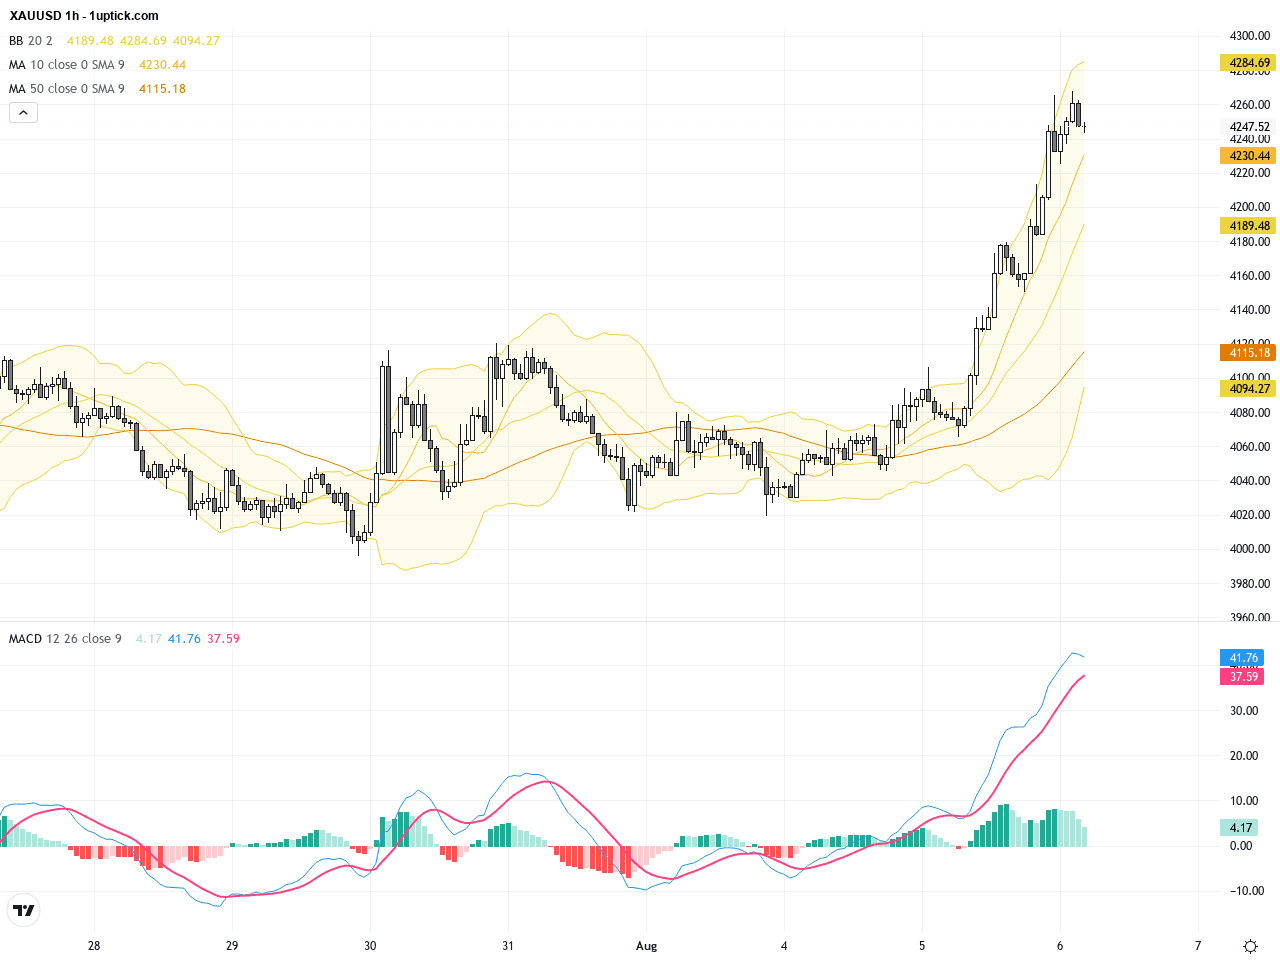
The hourly chart shows increased volatility over the past 3-5 days, with multiple tests and eventual break above the 4200 resistance. Price action near the upper Bollinger Band includes several long lower shadows candlesticks, indicating strong buying interest at dips. A MACD fast line crossover above zero reinforces the robust short-term momentum. Staying above 4200 supports continuation of the rise, supported further by bullish 50 and 200 EMA alignments.
Technical Trend: XAUUSD is currently in a decisively bullish trend, supported by both fundamental and technical factors.
Technically, XAUUSD completed a strong rebound phase, with a bullish MACD crossover and RSI hovering mid-range, showing healthy momentum. Holding the 4200 level will likely unleash further bullish extension. The breakout above a key consolidation range signals aggressive buying and resembles a classic flag pattern breakout, alerting traders to trend continuation potential. Rising daily volume confirms the strength and depth of this rally.Today’s economic calendar includes some indirect influences on XAUUSD, notably the US afternoon ADP Employment Change and ISM Non-Manufacturing Index. Forecasts for softer employment growth may weigh on the USD, potentially lending support to gold prices. Other global service sector PMI releases are mostly steady but no significant direct economic events are expected today to trigger major movements in XAUUSD.
Resistance & Support
The above financial market data, quotes, charts, statistics, exchange rates, news, research, analysis, buy or sell ratings, financial education, and other information are for reference only. Before making any trades based on this information, you should consult independent professional advice to verify pricing data or obtain more detailed market information. 1uptick.com should not be regarded as soliciting any subscriber or visitor to execute any trade. You are solely responsible for all of your own trading decisions.