







 |
| Gold V.1.3.1 signal Telegram Channel (English) |
AUDUSD: Hawkish Rate Hike Outlook Sparks Upside Momentum Amid Key Technical Breakout, August 31, 2026
2026-08-31 @ 06:01
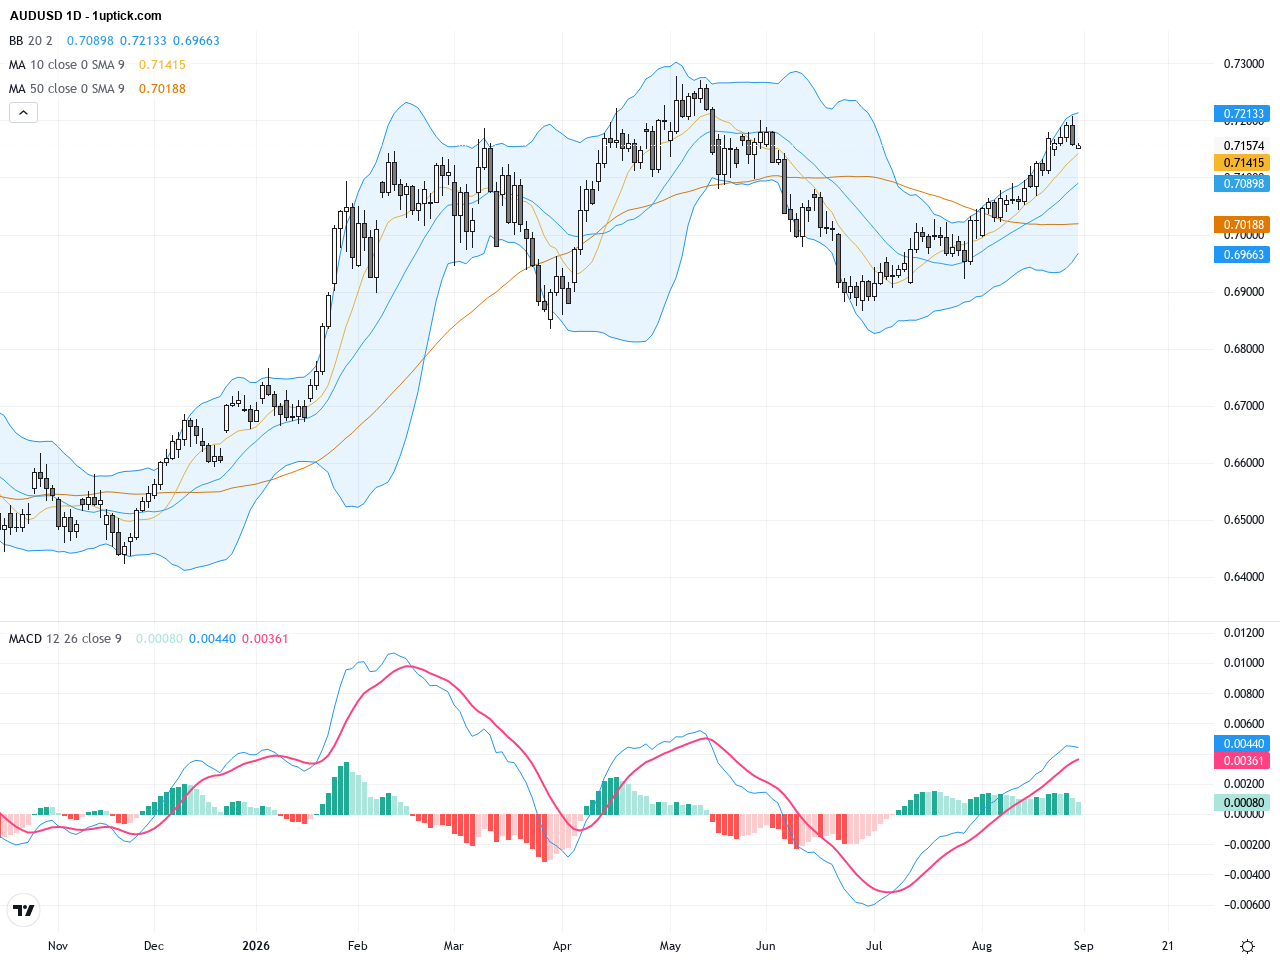
Over the past 24 to 48 hours, the AUD/USD pair has experienced notable volatility as of late August 2026. The closing price yesterday stood at 0.71575, down approximately 0.55% from the previous day’s close at 0.71968. This movement reflects the market’s swift reaction to a surprising uptick in Australian inflation, which has heightened expectations for further rate hikes from the Reserve Bank of Australia (RBA) in November.
According to the latest market news, Goldman Sachs revised its forecast on the back of July’s broad inflation surprise, projecting the RBA’s cash rate to reach 4.60%. This development has provided fresh rate support to the Australian Dollar, enhancing its appeal. Meanwhile, although risk-off sentiment persists slightly, the Pound-to-AUD rate has experienced upward pressure, limited by RBA’s hawkish stance. Additionally, a surprise US Treasury announcement weakened the US Dollar, pushing AUD/USD to a three-month high as traders keenly await Australia’s upcoming CPI data.
For the average investor, this market action is like a restaurant unexpectedly upgrading its menu to a popular new dish that energizes the whole venue briefly. The elevated expectations of a tightening rate environment have “ignited” the AUD, boosting it despite some short-term USD strength. This serves as a reminder that emerging global economic pressures may prompt further policy shifts, and currency market volatility is likely to remain elevated in the near term.
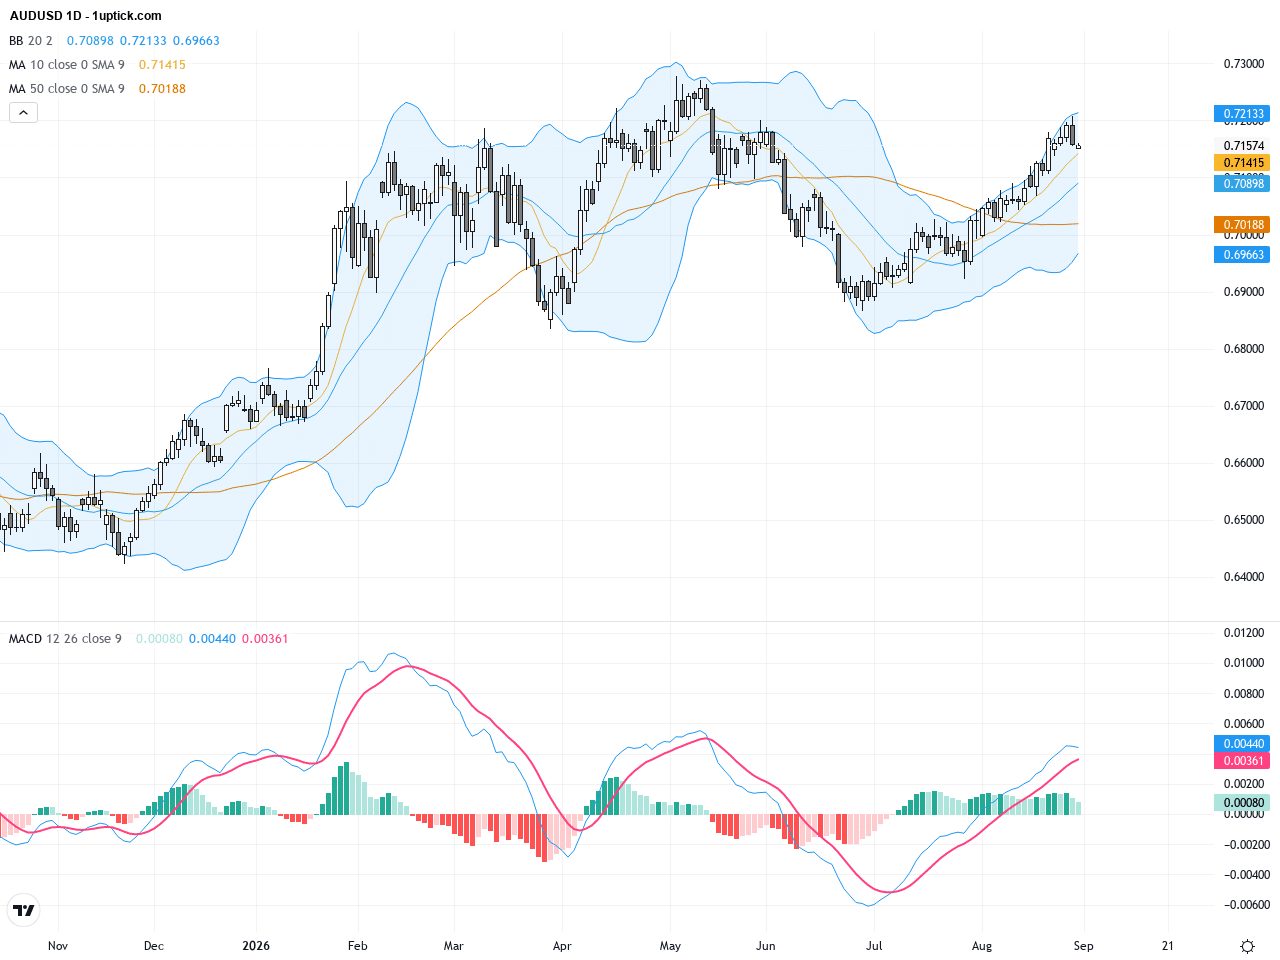
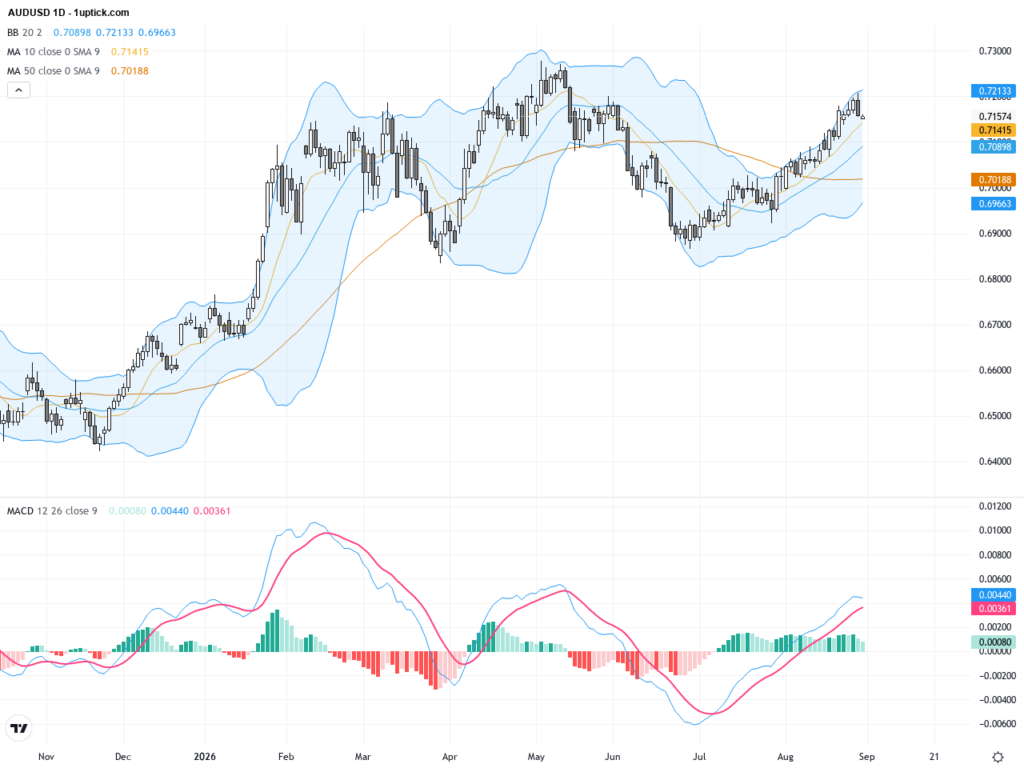
The daily chart reveals AUDUSD gradually recovering from recent consolidation, with price now firmly above both the 50-day and 200-day moving averages, highlighting a strengthening medium- to long-term uptrend. Bollinger Bands are widening, indicating increased volatility ahead. The MACD indicator shows the fast line approaching the slow line, suggesting a potential bullish crossover that would bolster upward momentum.
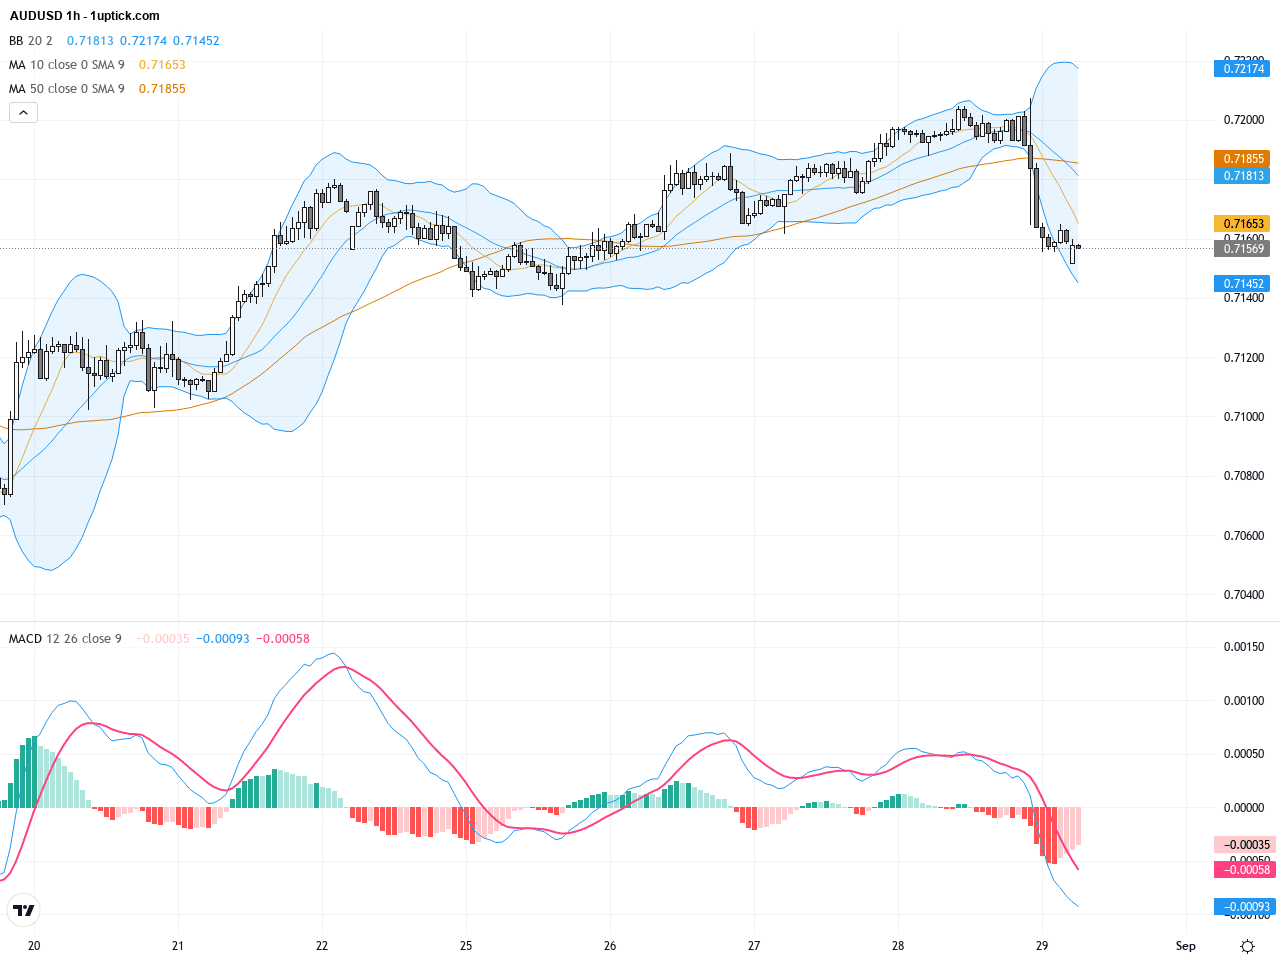
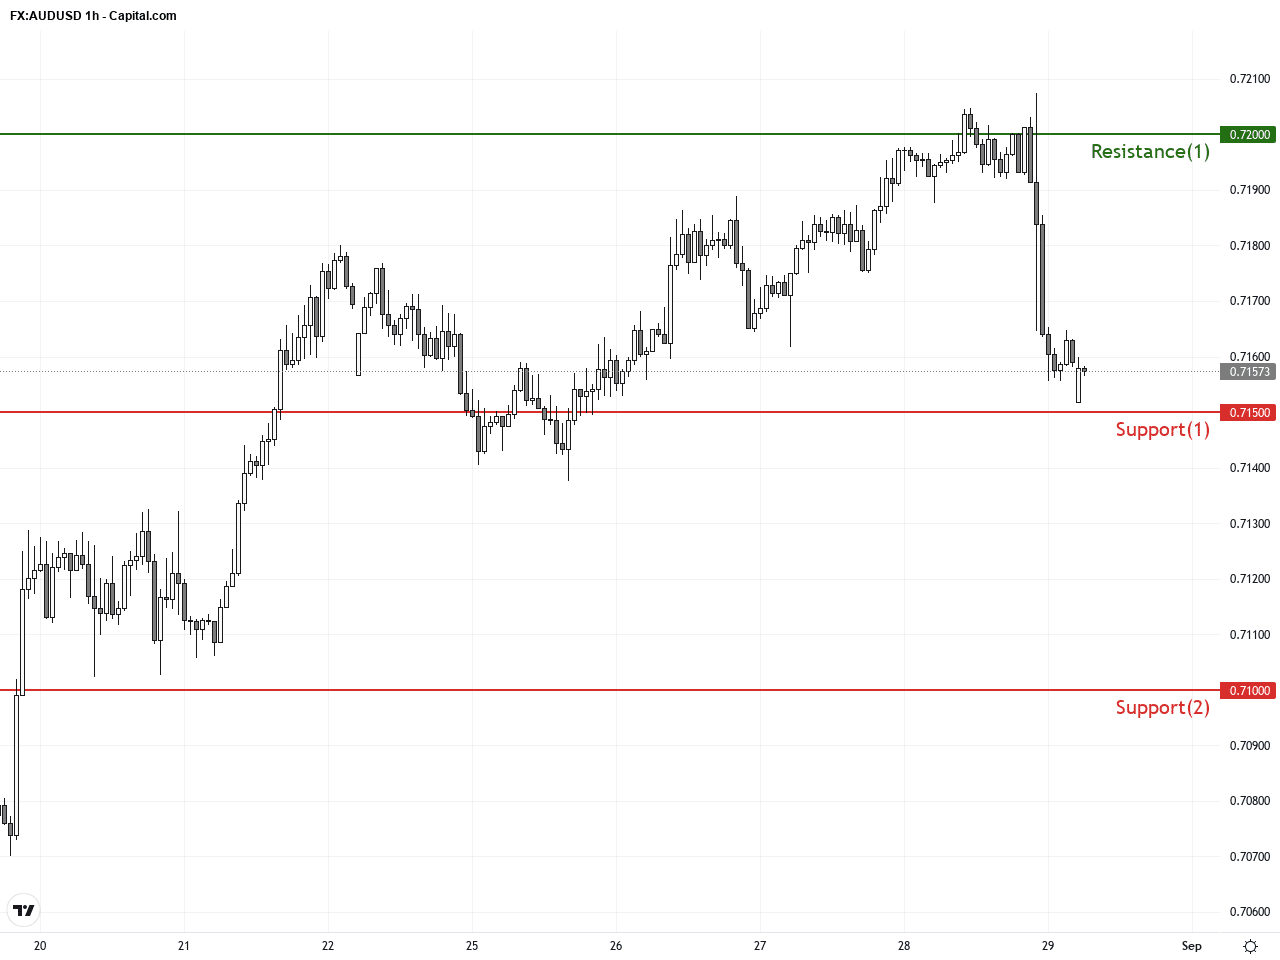
Hourly chart analysis over the past 3-5 days shows price oscillating between support near 0.7050 and resistance around 0.7170. Recent breakout above 0.7150 was followed by mild retracement, with price holding near the middle Bollinger Band line. The MACD remains above zero with a soft convergence, and RSI holds at mid-to-high levels, confirming short-term buying interest but hinting at possible near-term corrections.
Technical Trend: Currently exhibiting a cautiously bullish trend with solid upward signals but susceptible to short-term volatility and pullbacks.
Technically, AUDUSD is on the verge of a MACD golden cross and maintains price above key moving averages, reinforcing a bullish trend structure. The recent break from a consolidation zone provides clear support-resistance flips, while an emerging bullish flag pattern signals further upside potential. On a shorter timeframe, watch for narrowing price action and Bollinger Band shifts as trade opportunities in the next leg emerge.Today’s economic calendar features key releases from Japan including July Industrial Production and Retail Sales, along with Australian data such as the August Melbourne Institute Inflation Gauge and Q2 Business Inventories. While these events could influence AUD price action modestly, significant market-moving volatility is unlikely. Investors are more focused on broader inflation trends and RBA’s monetary policy stance, which remain the principal drivers for AUDUSD.
Resistance & Support
The above financial market data, quotes, charts, statistics, exchange rates, news, research, analysis, buy or sell ratings, financial education, and other information are for reference only. Before making any trades based on this information, you should consult independent professional advice to verify pricing data or obtain more detailed market information. 1uptick.com should not be regarded as soliciting any subscriber or visitor to execute any trade. You are solely responsible for all of your own trading decisions.