 |
| Gold V.1.3.1 signal Telegram Channel (English) |
Gold Trend 05/08 – The spot gold price is losing upward momentum despite the expectations of a Fed. Rate cut increasing
The spot gold price went up during the week but fell after Friday’s US non-farm payroll report. Looking back at last week, the price broke through the 2400 resistance before the Fed—meeting on Wed. The price kept on rising after Powell’s dovish speech, and tensions rose in the Middle East as Iran’s leader ordered attacks on Israel in response to the assassination of a Hamas leader. The US released weaker-than-expected job data on Fri., causing gold prices to hit a weekly high and rechallenge the historical peak 2480. However, the market quickly focused on concerns that the US economy might enter a recession. US stocks rapidly fell from their highs, dragging gold prices down to a daily low of 2410, closing the week at 2442.
According to CME FedWatch, the latest interest rate futures indicate that the probability of a 50 basis point rate cut in September increased from 22% on Thursday to 95% early in the Monday Asian session. Whether in the gold or stock markets, a rate cut should boost the market. However, despite reaching twice above 2450 in the past month, the spot gold price didn’t have any significant new long-buying position above 2450 but profit-taking and new short-selling positions. The market now broadly expects the first rate cut to happen in September. As the first rate cut approaches, it is almost time for investors who entered long for the ‘rate cut’ concept at the beginning of the year to plan their exit. ‘Buy on the rumour, sell on the news’ ~ gold prices may still hit a new high before September, but expect a significant correction around the first rate cut!
>
1-hour Chart > The price still runs within the upward wedge(2). In the S-T, gold prices are supported by the trendline(2.1). If this support is broken, a significant correction may occur, with a target of 2400. Currently, the range of 2450-53 is acting as an S-T resistance zone, while stronger resistance is expected at 2478-80.
>
Daily Chart > No major economic data are expected to be released this week, and gold prices are unlikely to break high. The initial expectation is to work within the range of 2410-80 established last Friday.
P. To
Gold Trend 22/07 – Failed to clear 2450
Entering a consolidation cycle after gold failed to stay above 2450.
Gold price broke through the previous historical high of 2450(1) early last week on Tuesday, triggering a round of buying and rising to a weekly high of 2483 within 24 hours. However, the upward momentum failed to carry on at a high level. According to the market data from CME, gold futures showed significant new short positions entering the market on Wednesday. Short-selling accelerated after the U.S. released manufacturing data on Thursday, when the price fell below the key support of 2450(2), and the market closed near 2400 before the weekend. After the false break above 2450, it will be hard for gold to return back above 2450 in the near term without any consolidation. This week, focus on Thursday and Friday’s U.S. GDP and the core inflation data.
>
1-hr chart > Gold price supports the previous week’s low of 2390-2400. Before the next move, take advantage of the 2391-2440(3) range early this week. If the gold price breaks below 2385(4), the downside target will be 2350(5).
>
Daily chart > The decline in gold prices is accelerating, with a single-day drop of more than $40 on Friday. The short-term support is at 2400(7), and the lower target can grasp the 20-day moving average.
>
Weekly chart > Gold prices are on a L-T upward trend that originated from 2018. Last week’s peak has created a reversal signal on the chart (10). The target below can now be aimed at the bottom of the range 2300 (11).
P. To
Gold 15/07 – Preparing for a new high ?
The gold price was stimulated by the easing inflation data from the US last week, breaking through the post-non-farm resistance of 2391(2) and touching a four-week high of 2424. Referring to CME gold futures’ data, the total number of Open Interest last Friday reached the highest level of 540k contracts, which is above the 530k contracts at the time of the record high of 2450 in May, a bullish sign as more funds are now attracted by the gold market. Not many important economic figures are scheduled to be released this week. Let’s see if the price can stay above 2391 this week. The longer the price remains at around 2400, the more investors will be ready for a new high.
>
1-hr Chart > The price of gold is still running in the ascending channel (1), originating from the end of June. After breaking through the resistance (2) last Thur, the high and low in the past 48 hours have formed a side-way channel (3). Without any critical economic data this week, we can take advantage of the 2319-2425(3) range at the beginning of this week. It must be noted that a new round of selling will trigger if the price clears the support of 2391(2), and the downside target can be set around 2358-60(4).
>
Daily Chart > The range of 2277-2431(7) now dominates as the price trades above 2380. The Cup & Handle (6) pattern is yet to be confirmed. If the gold price can clear the resistance (6) in the next two weeks, a new round of M-T buying will begin.
P. To
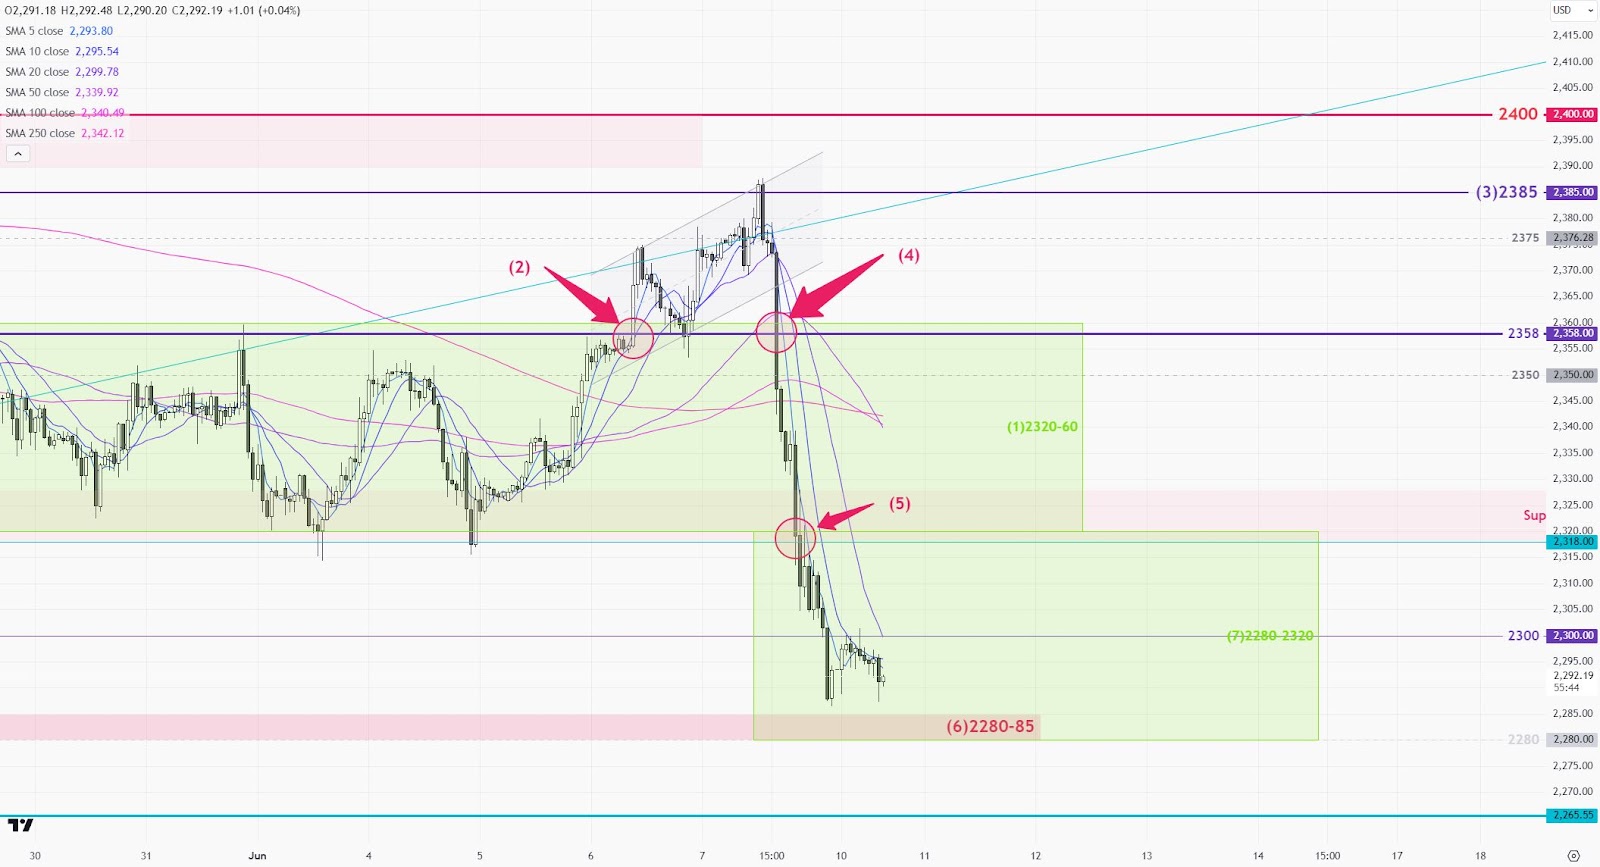
Gold Trend 10/06 – Consodiate further this week ?
Gold price experienced the largest single-day decline in recent months last Friday, downed by $82. The price stayed within the range of 2320-2360(1) early last week until Wednesday after a disappointing ADP employment figure was released. It cleared the resistance(2) in the Asian session on Thursday. The breakout triggered a new round of buying, resulting in a weekly high of 2387(3) within 24 hours. However, the gold price started selling at the European session on Friday, again back into the previous sideways range(1). After the release of US employment data that evening, the price fell below 2320(5) and touched our target of 2300, closing at the weekly low near 2286.
As mentioned last week, the gold market is in a profit-taking cycle. The latest data from the COMEX gold futures shows that the open interest continues to decline, at 440,000 contracts now. This is about 90,000 contracts less than the peak when gold prices reached a historical high a few weeks back. This indicates that the long buying is still on the limited side, and there is still room for further decline. The key events this week are the US inflation data and the FOMC meeting on Wednesday. Take advantage of a range-bound market while investors are waiting for these economic figures at the beginning of the week. From the M-T perspective, gold prices are still in the phase of consolidation. It will be a good chance to short-sell the market if the high level of uncertainty this week leads to a jump in gold prices.
1-hr chart > The key support level is at the previous low of 2280-2285(6). Expect the price to be bounded within the range of 2280-2320(7), while the market is waiting for Wednesday’s news. A new round of selling will be triggered if the price breaks through the support zone(6).
Daily Chart > Gold cleared the ascending channel(9) last week. The closing near the weekly low on Friday indicates that the selling is still dominating the market, and the price might have another attempt to the low in the next 2 days. In S-T, support lies at the previous low of 2277 (10). If there is a successful breakthrough below 2277(10) later this week, the first target can be set at the 50% retracement level around 2216(11).
P. To