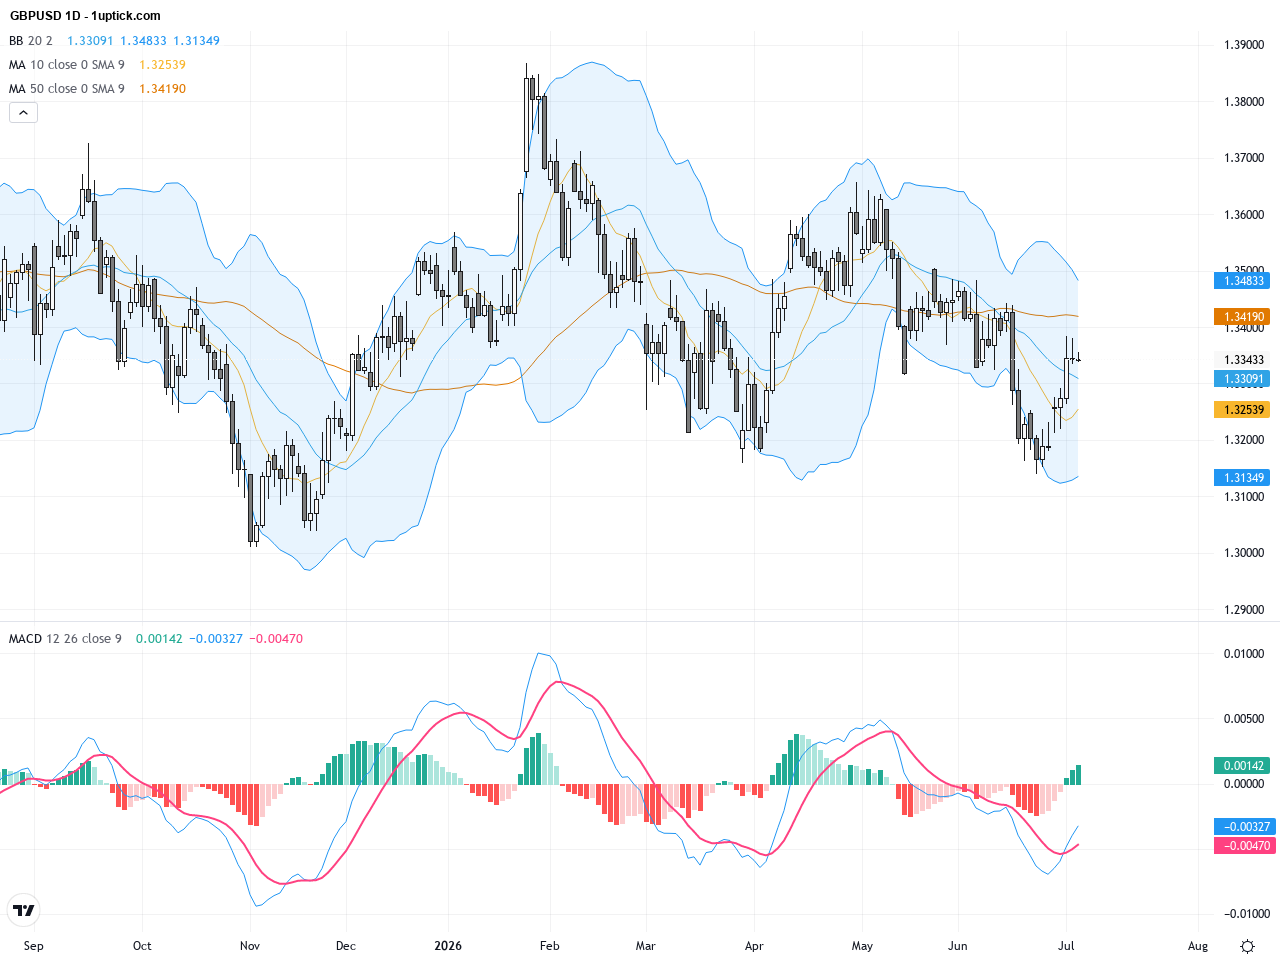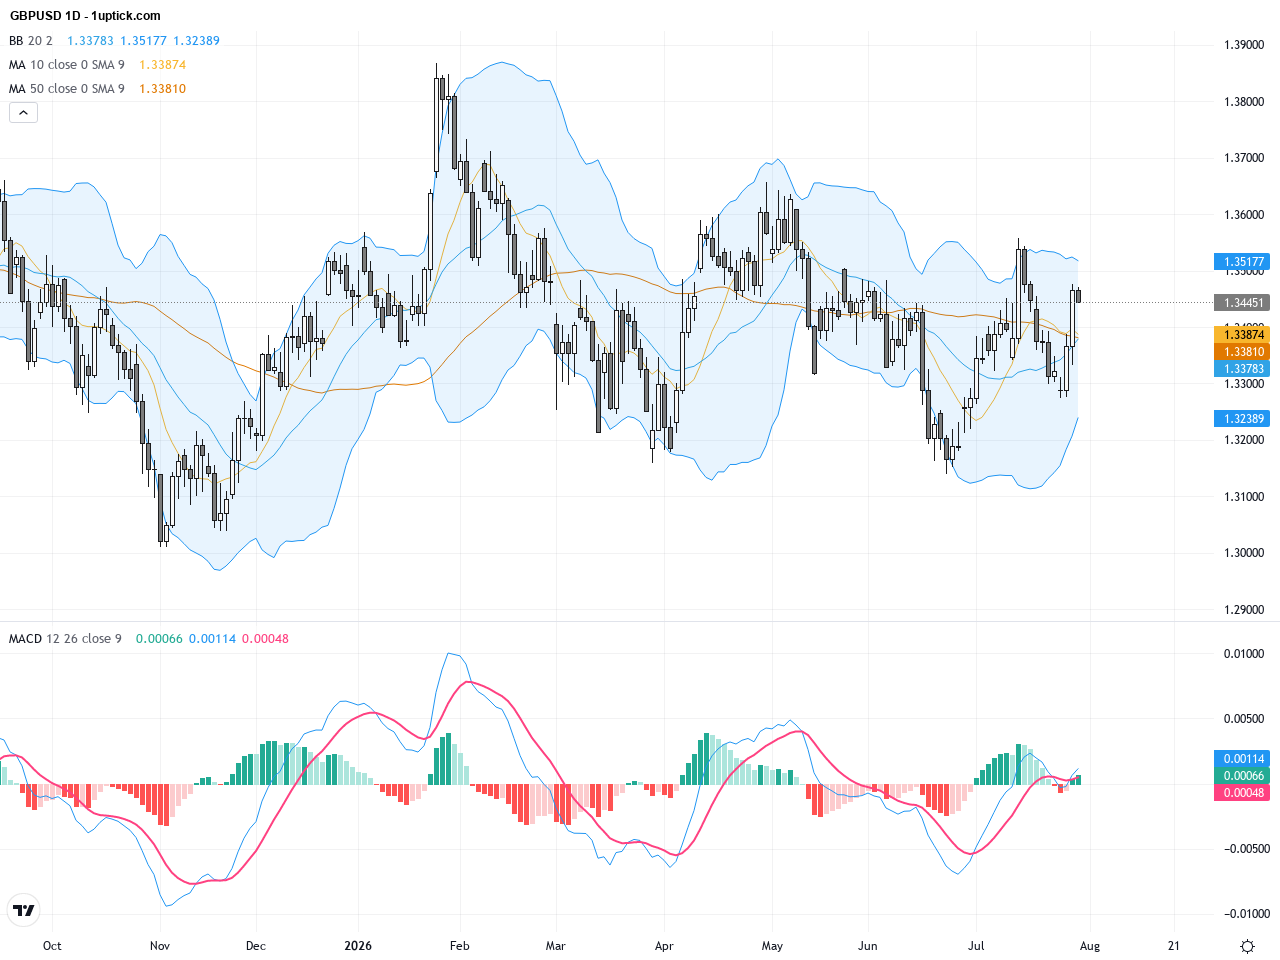
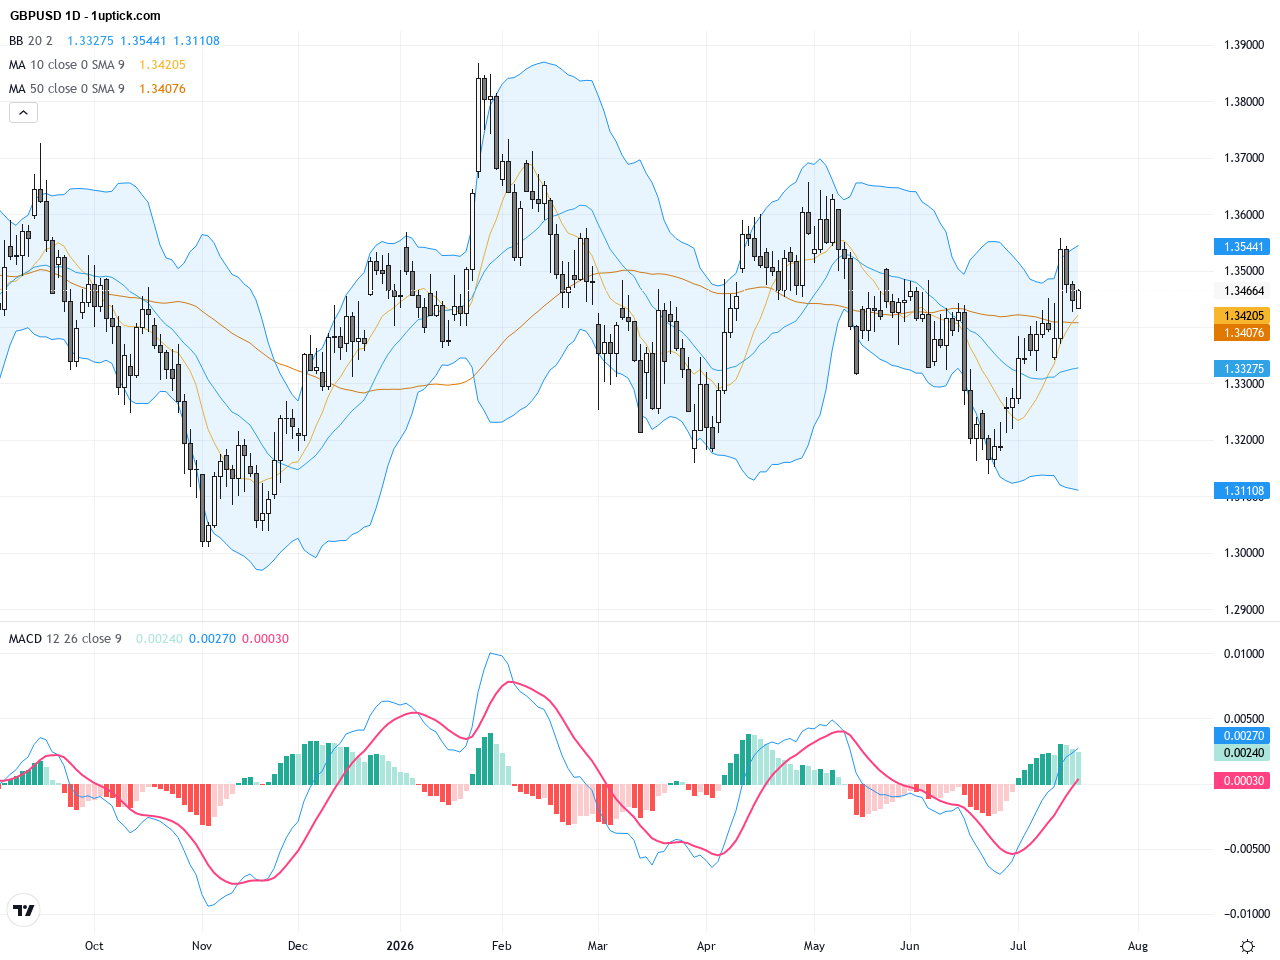
GBPUSD: Technical Patterns and Political Risks Shape Pound-Dollar Trading Outlook, July 20, 2026
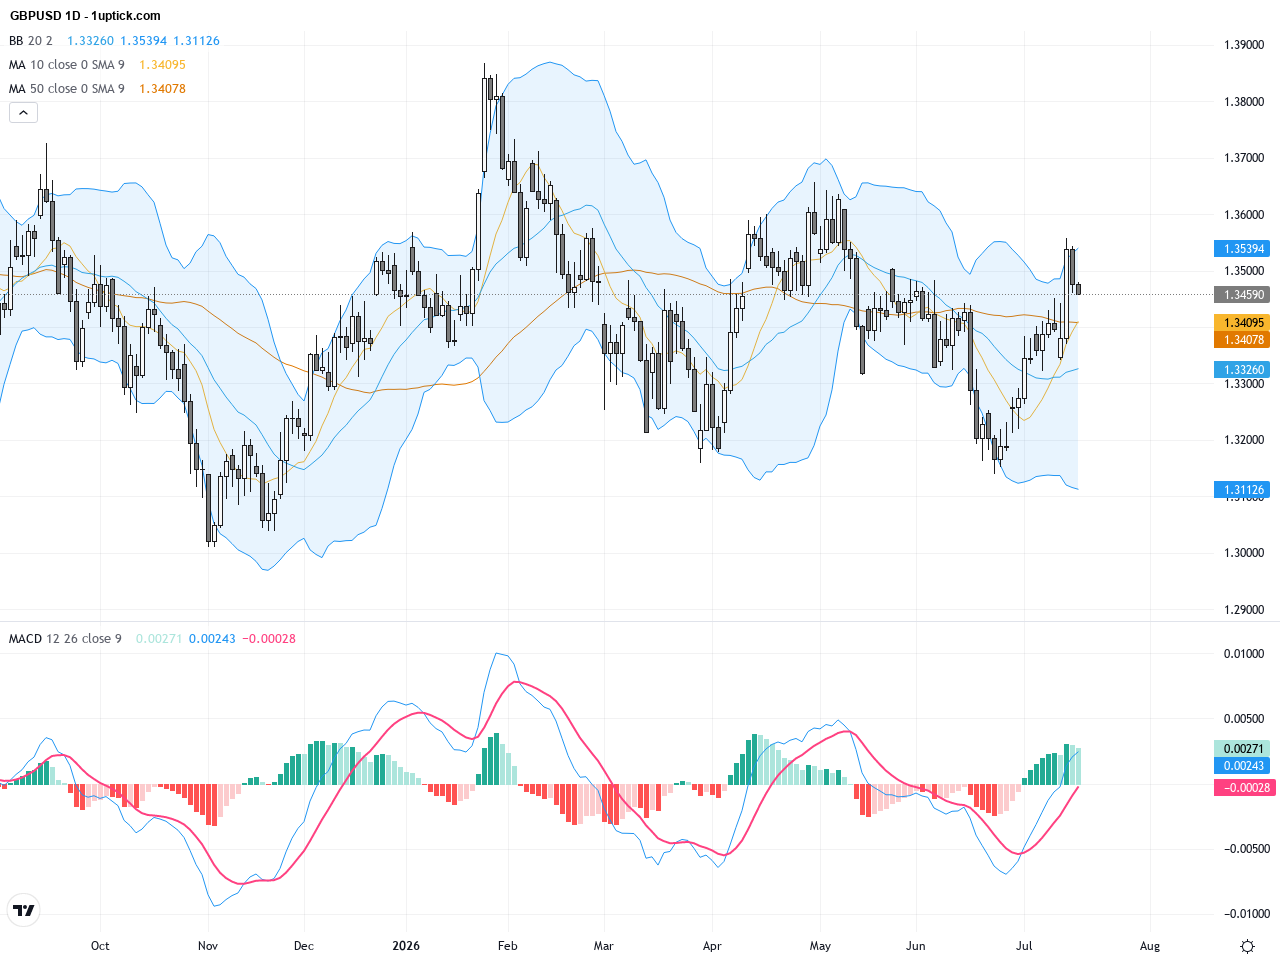
GBPUSD has experienced notable volatility over the past three trading days, closing at 1.34665 yesterday with a modest 0.137% gain. The market mood is driven by mixed factors: improving UK political sentiment boosting Sterling confidence, as noted by UniCredit, versus heightened US-Iran tensions strengthening the US dollar and pressuring GBP. This tug-of-war leaves the pair near a pivotal level around 1.3400. For everyday investors, it’s like being on a rollercoaster with rapid sentiment swings driven by geopolitical news. The near-term outlook for GBPUSD is fragile, hinging on political developments and key technical support/resistance levels.