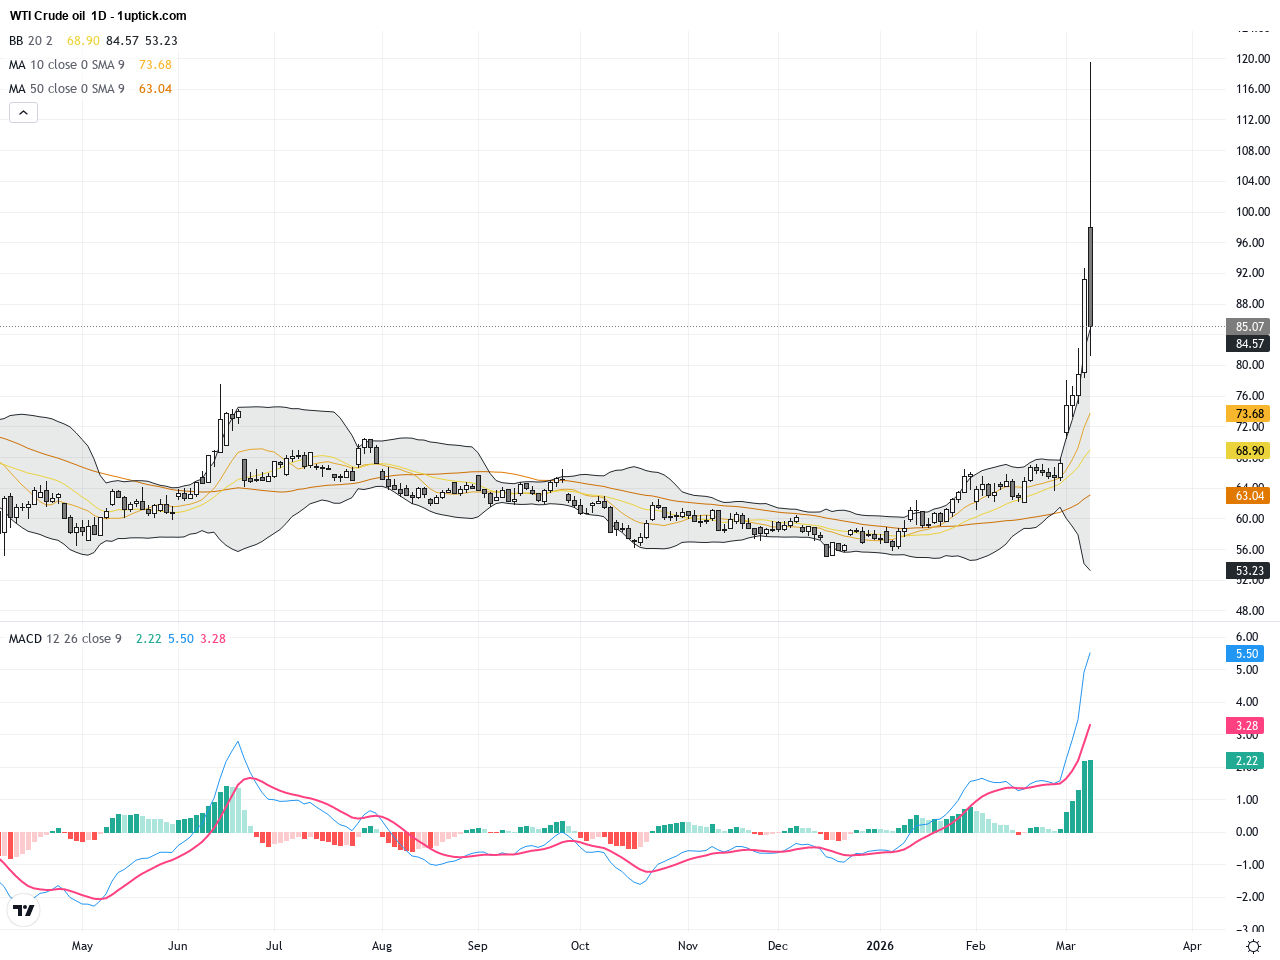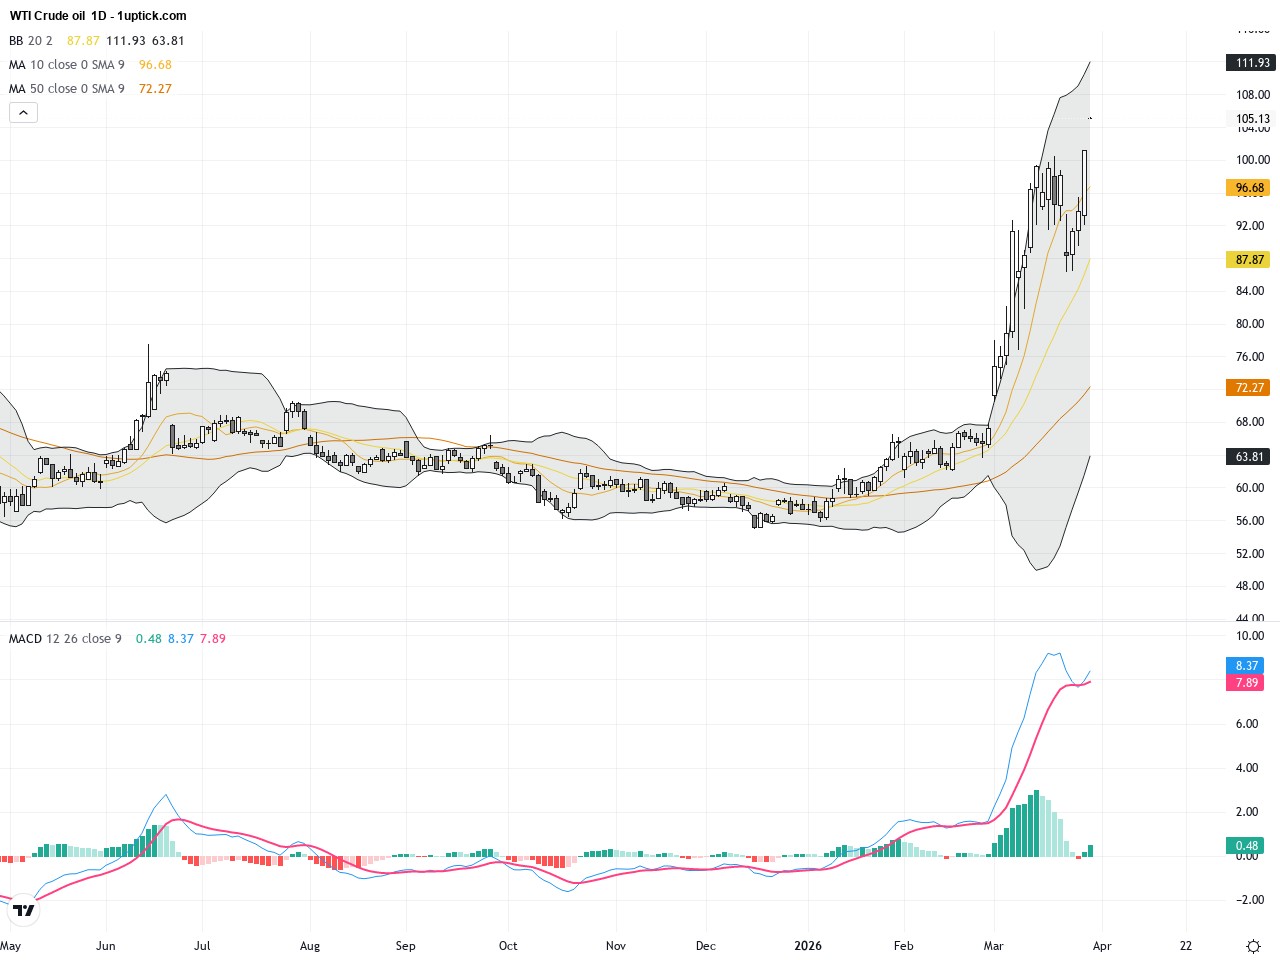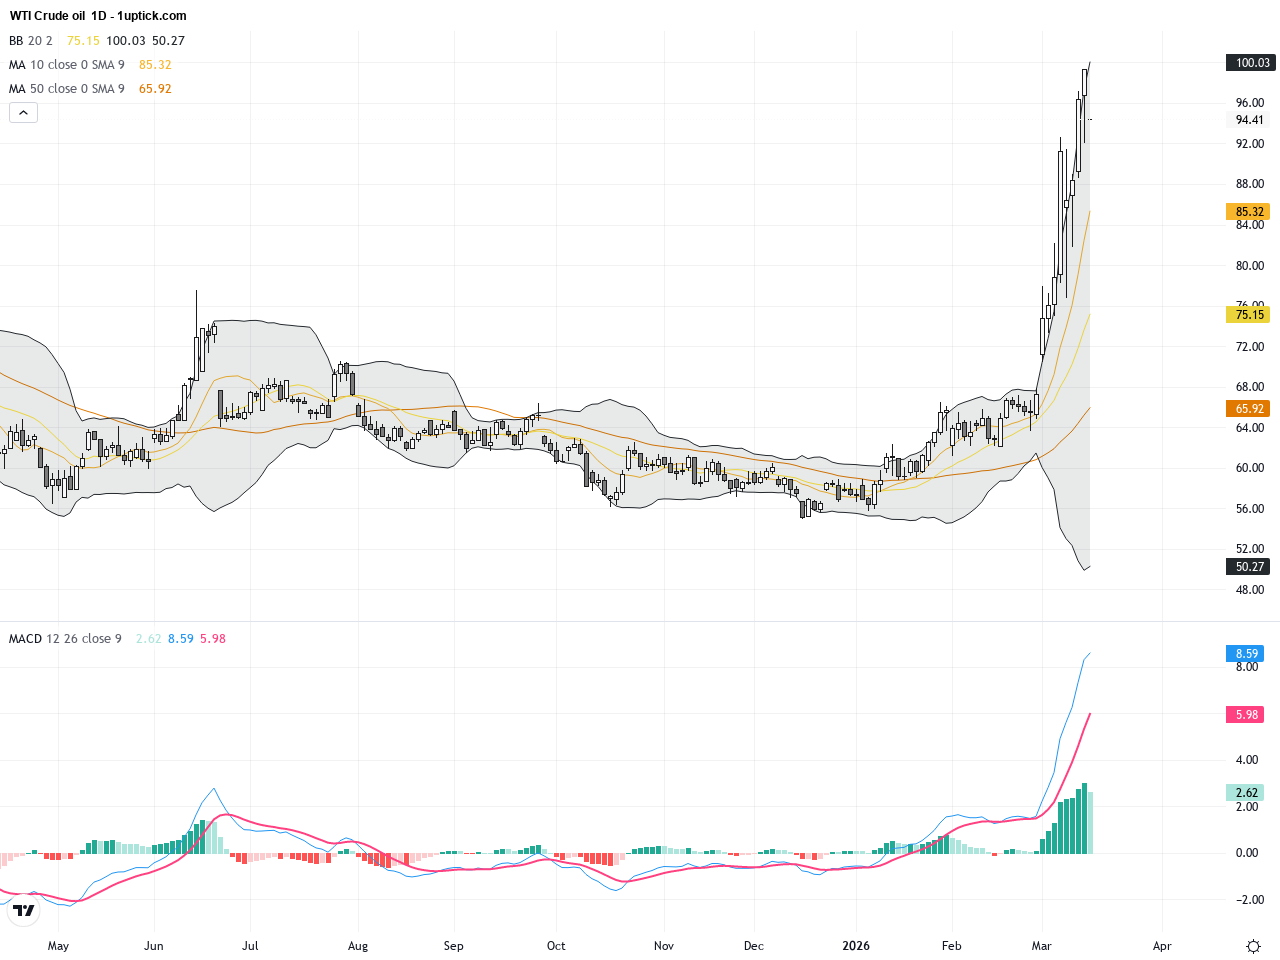
WTI Crude Oil: Key Strait of Hormuz Shipping Boosts Volatility in Price Technical and Fundamental Analysis
Over the past three trading days, WTI Crude Oil has experienced significant volatility, closing yesterday at $93.5 after a sharp decline from the previous day. The ongoing geopolitical tensions in the Middle East’s Strait of Hormuz, particularly the recent transit of some vessels, led to an approximate 3% drop in prices. This week, crude has surged over 40% amid war risk fears and supply concerns, hitting the highest levels since 2022. Market sentiment remains highly sensitive to geopolitical developments, while energy sector stocks have gained support following analyst upgrades. For the average investor, this means that uncertainties in the oil market persist, and short-term trading requires caution. Close attention to geopolitical news and technical indicators is crucial to capitalizing on the market swings.