


 |
| Gold V.1.3.1 signal Telegram Channel (English) |
Gold Trend 30/09
2024-09-30 @ 17:50
Carrying the upward trend from the week before, gold prices hit a new high, pricing in the US Fed. additional 0.25% rate cut last week, in line with our expectations. The current uptrend started from 2550 after the meeting, and the upward momentum has finally slowed down after reaching a peak at 2685 on Thursday. The latest OI data from CME showed some slight profit-taking in the market before the weekend.
After the US Fed. meeting and China’s recent economic stimulation policies, the market is still in a kind of excited state. The CME fed. watch indicates that the probability of a 0.5% rate cut in November has increased from 48% at the end of last week to the latest 54% today. As long as the upcoming U.S. economic data in the next few weeks remains “normal,” and in line with market expectations. The gold market should behave the same as in late Aug. and early Sept. with a backdrop of the market speculating another 0.5% rate cut at the next Nov. meeting,
The focus this week is on Friday’s U.S. employment data. If the data exceeds expectations, gold may give us a deeper correction.
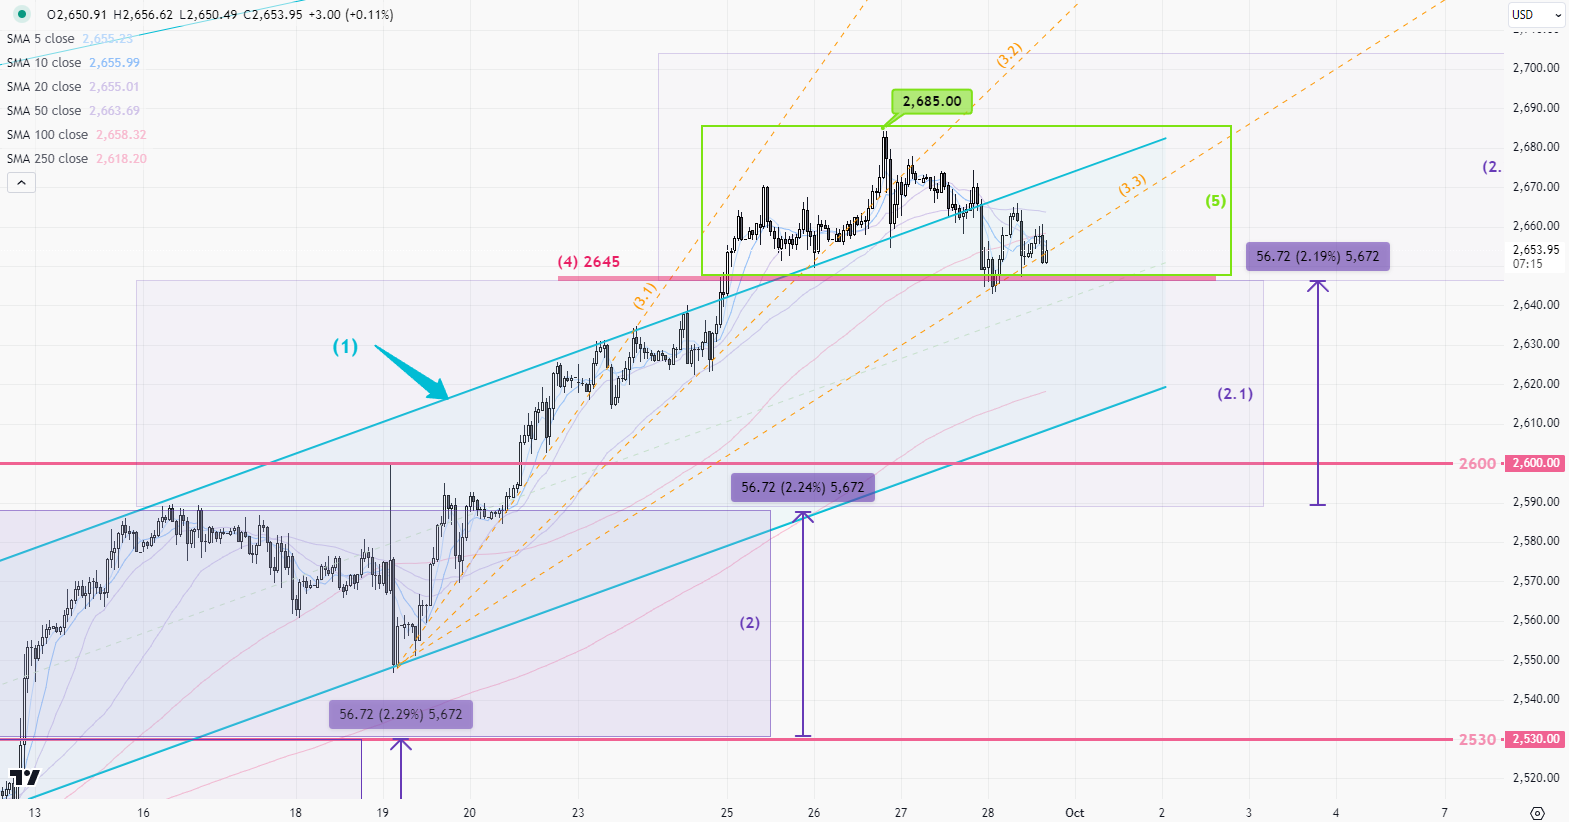
1-hour Chart > Last week’s target of 2645-50, based on the sideway range 1:1 ratio(2), has been achieved, and the price continues to break higher. However, it is important to note that the upward trend began to slow down towards the end of last week, with the upward momentum slowing further from support line(3.1) to (3.2) and then to (3.3). The S-T operating range is between 2645-85(5) for now. The key support level is at 2645 (4), and if this level is breached towards the end of this week, the operating range will shift down to 2600-2645.
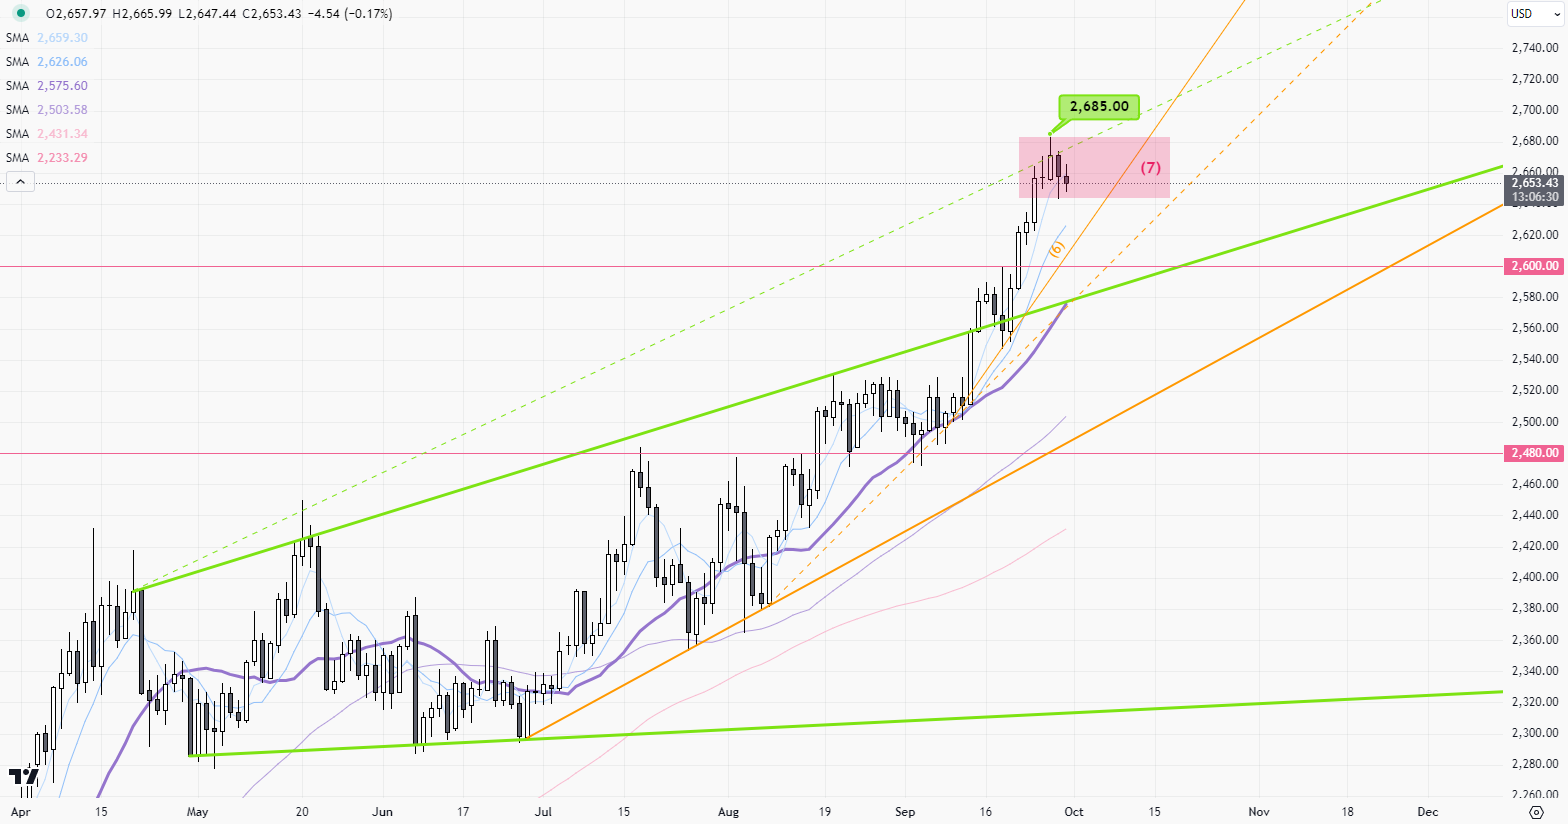
Daily Chart > 2685 appears to be the current top. Temporarily takes the high and low of last Thu. and Fri.(7) as a trading reference(7). If the price breaks below 2645, the support line (6) and the 20-day MA should be the downside target in the coming two weeks.
P. To