
 |
| Gold V.1.3.1 signal Telegram Channel (English) |
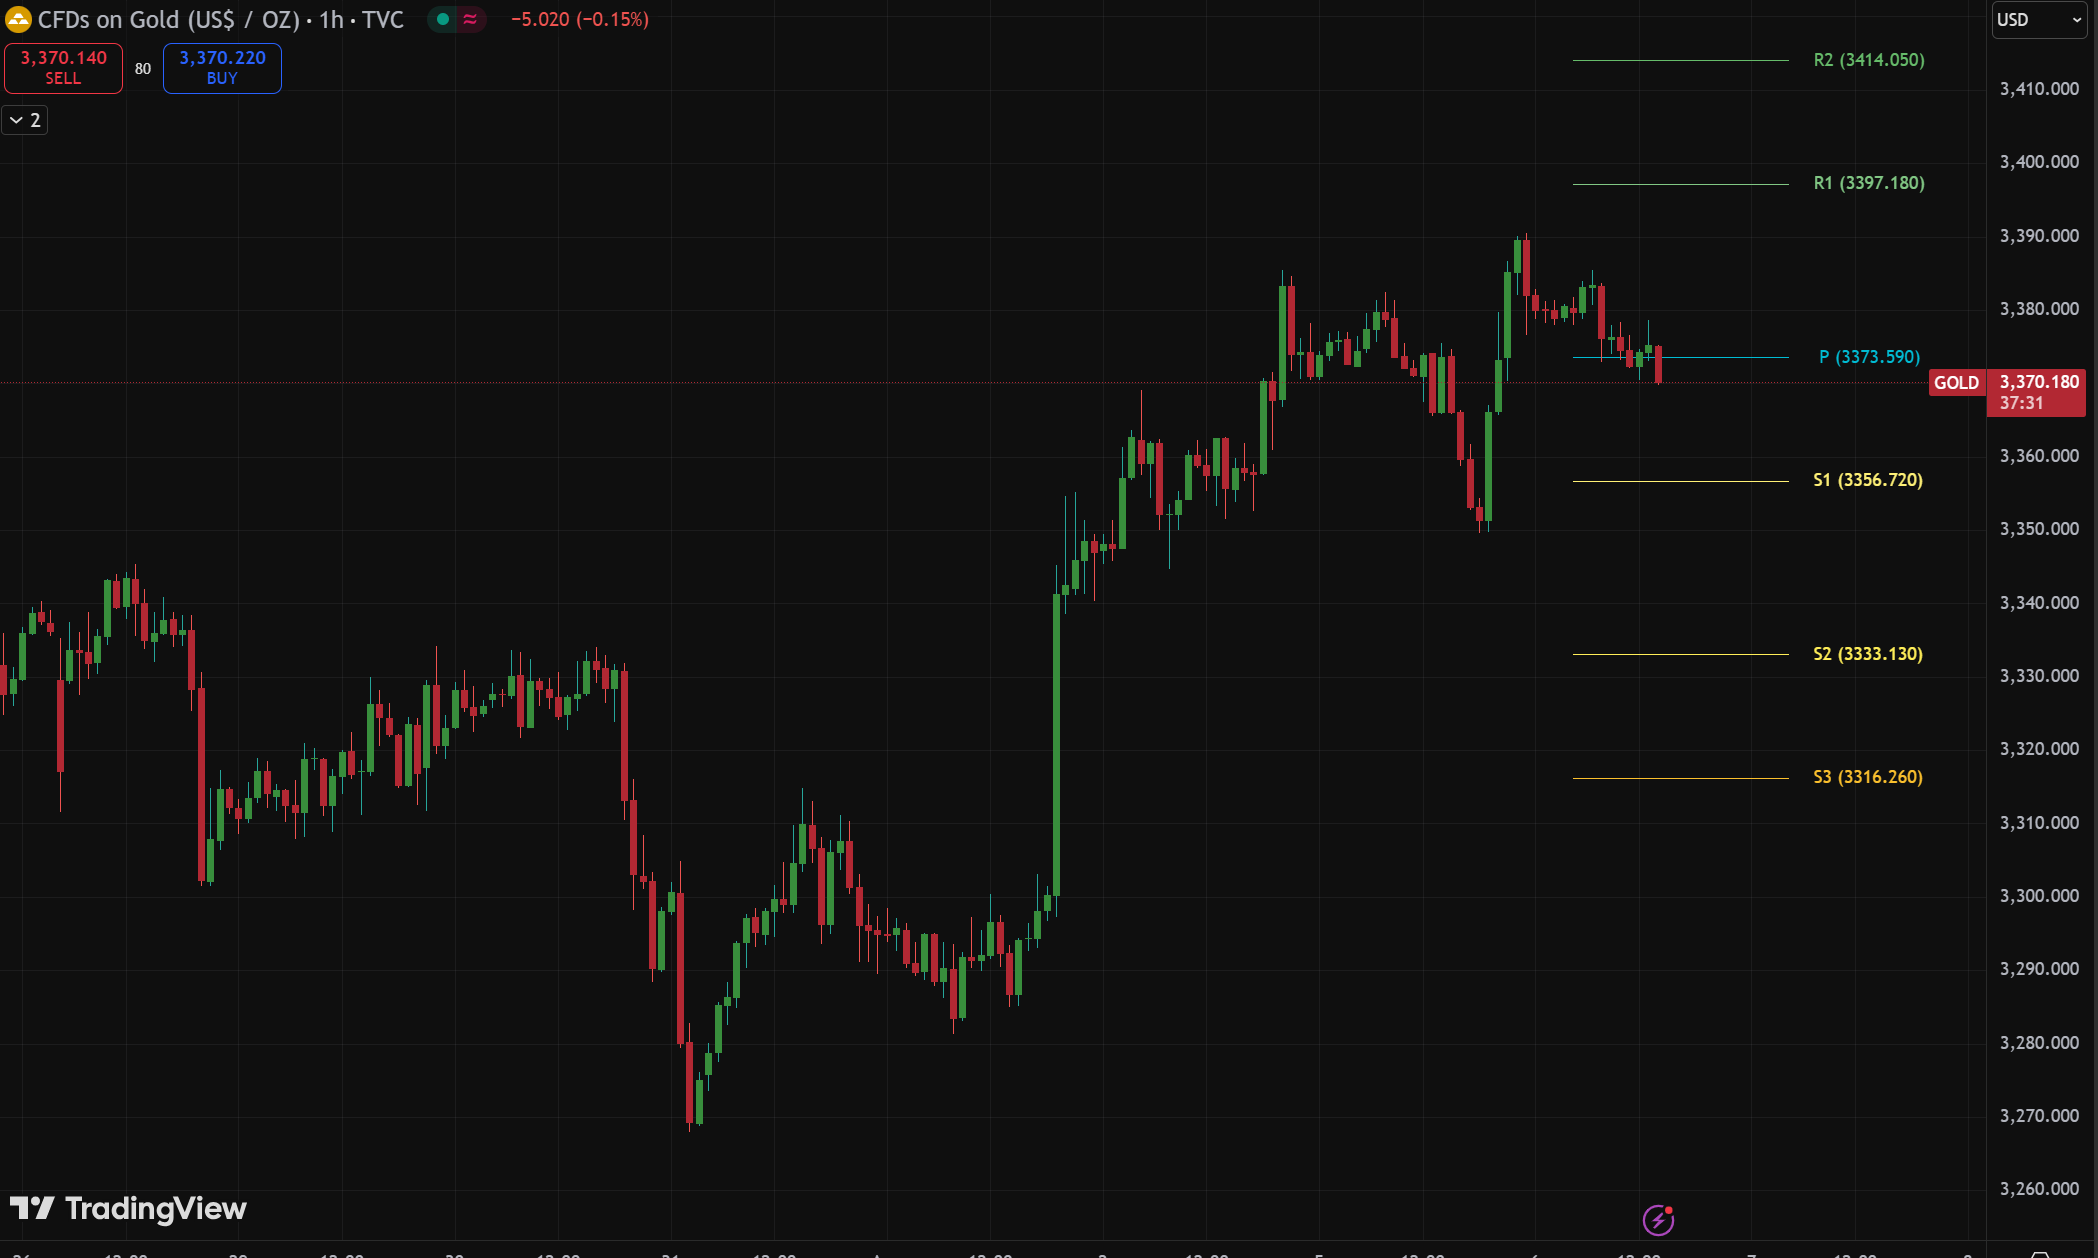
XAUUSD-1 hour
2025-08-06 @ 15:24
Market Overview
Gold (XAUUSD) experienced volatile movement over the past week, trading between $3,270 and $3,400 per ounce. After a brief dip, bullish momentum returned as weak US Nonfarm Payrolls data increased expectations of a Federal Reserve rate cut in September, weakening the dollar and supporting gold prices. Technical indicators show gold rebounding from key support levels, with buyers regaining some control. However, mixed signals persist after July’s bearish monthly close, and further upside depends on a decisive move above resistance near $3,431. Near-term direction hinges on upcoming US economic data and shifts in Fed policy expectations.
Gold (XAUUSD) on the 1-hour timeframe currently exhibits signs of a prevailing uptrend, underpinned by higher swing highs and higher swing lows, with price action remaining above key short-term support. The chart shows the metal consolidating gains within a narrowing range, suggesting a pause or pullback may precede the next directional move.
Technical Indicators and Signals:
– Moving Averages: Price is holding above the key short-term moving averages, which act as dynamic support and confirm bullish momentum on the 1-hour chart. This aligns with recent intraday trend analysis that points to a sustained uptrend.
– Bollinger Bands: There are indications of price consolidating near the upper band, which sometimes precedes minor reversals or pullbacks but also reflects underlying strength as long as support holds.
– RSI (Relative Strength Index): Momentum appears supportive but not extended into overbought territory, suggesting room for further gains before a deeper correction is likely.
Prominent Chart Patterns:
– The price structure reveals a narrowing consolidation zone, which may be interpreted as a pennant or flag pattern in the context of a recent rally. Such formations often resolve in the direction of the prevailing trend, favoring a bullish breakout if support holds.
– There is no clear presence of reversal patterns such as a head and shoulders or double top/bottom on the visible portion of the chart.
Notable Candlestick Patterns:
– Recent candles near support show wicks to the downside, implying buying interest on dips. There are no strong reversal single or multiple-candle patterns (such as bearish engulfing or shooting star) that would imply an imminent trend reversal.
– Individual bullish candles with long lower shadows near support reinforce the short-term bullish bias.
Trend Direction:
– The 1-hour trend is up, with minor consolidation indicating healthy market digestion rather than a full trend reversal. Higher swing lows and sustained positioning above key moving averages support this outlook.
Major Support and Resistance Levels:
– Immediate support is identified at 3314.85; a decisive bearish break below this level would signal the end of the uptrend on this timeframe and open the door to deeper pullbacks.
– Resistance levels are seen incrementally around 3322, 3341, and 3350, with further upside potential if these are breached.
Additional Technical Insights:
– The market has exhibited a series of advancing impulse waves, characteristic of Elliott Wave bullish structure. With price now consolidating, a minor wave 4 pullback is possible before a renewed push toward new short-term highs.
– There is no visible volume data, but the technical structure suggests positive momentum, provided price does not lose its immediate support.
Actionable Outlook:
Gold (XAUUSD) maintains an intraday uptrend within a consolidative structure on the 1-hour chart. The technical bias favors buying opportunities on dips above 3314.85, with risk controls in place below this support. A confirmed breakout above resistance at 3322 would inject fresh bullish momentum, while a failure to hold above 3314.85 would negate the immediate long bias and warn of a deeper retracement. Traders should monitor price action closely around these levels to gauge the next significant move.