


 |
| Gold V.1.3.1 signal Telegram Channel (English) |
USDJPY: Political Uncertainty Drives Break Above Key Resistance 155.50 – Trading Outlook Brightens
2026-02-04 @ 11:01
Over the past 24 to 48 hours, the USD/JPY currency pair has experienced notable volatility, with yesterday’s closing price around 156.26. The recent market action has mainly been driven by political uncertainty and fiscal concerns in Japan, which have pressured the Japanese yen. This weakness helped push USD/JPY beyond the 155.50 level, reaching highs near 155.85 during the session. Japanese Prime Minister Sanae Takaichi’s expansionary fiscal policy has raised investor concerns about the widening economic and interest rate gaps between the US and Japan.
At the same time, the Chinese yuan strengthened following the People’s Bank of China setting its daily fixing at the highest level since May 2023, triggering ripple effects in Asian currency markets. Although the Singapore dollar consolidated against the US dollar, markets anticipate that the Federal Reserve may keep rates elevated for a longer duration, limiting the dollar’s upside momentum.
In summary, these combined factors of political instability and economic policy divergence have reinforced USD/JPY’s strength, reflecting investor skepticism over a near-term yen recovery. For the average investor, this situation is akin to a complex interplay of political and economic forces, suggesting a need for caution as Japanese fiscal health and policy decisions remain key variables influencing future yen volatility.

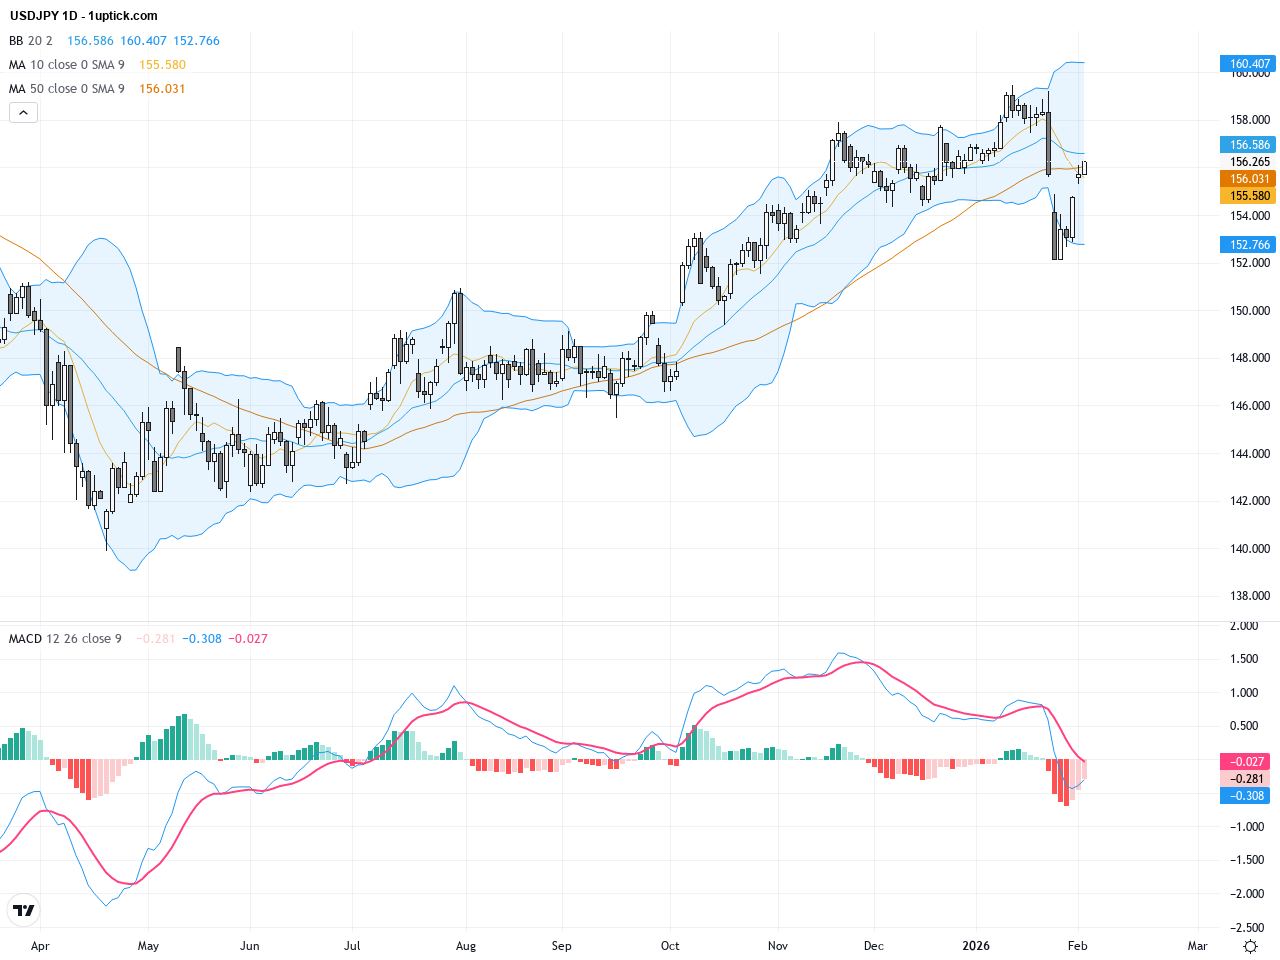
The daily chart reveals a clear upward trend for USDJPY since the start of the year, trading comfortably above the 50-day moving average and oscillating between 150 and approximately 157. Recently, the pair broke out of a consolidation zone with Bollinger Bands widening, indicating an increase in volatility. The MACD remains in bullish territory with the fast line trending upwards, confirming strong upward momentum. Overall, the daily chart signals a robust bullish trend with healthy momentum.
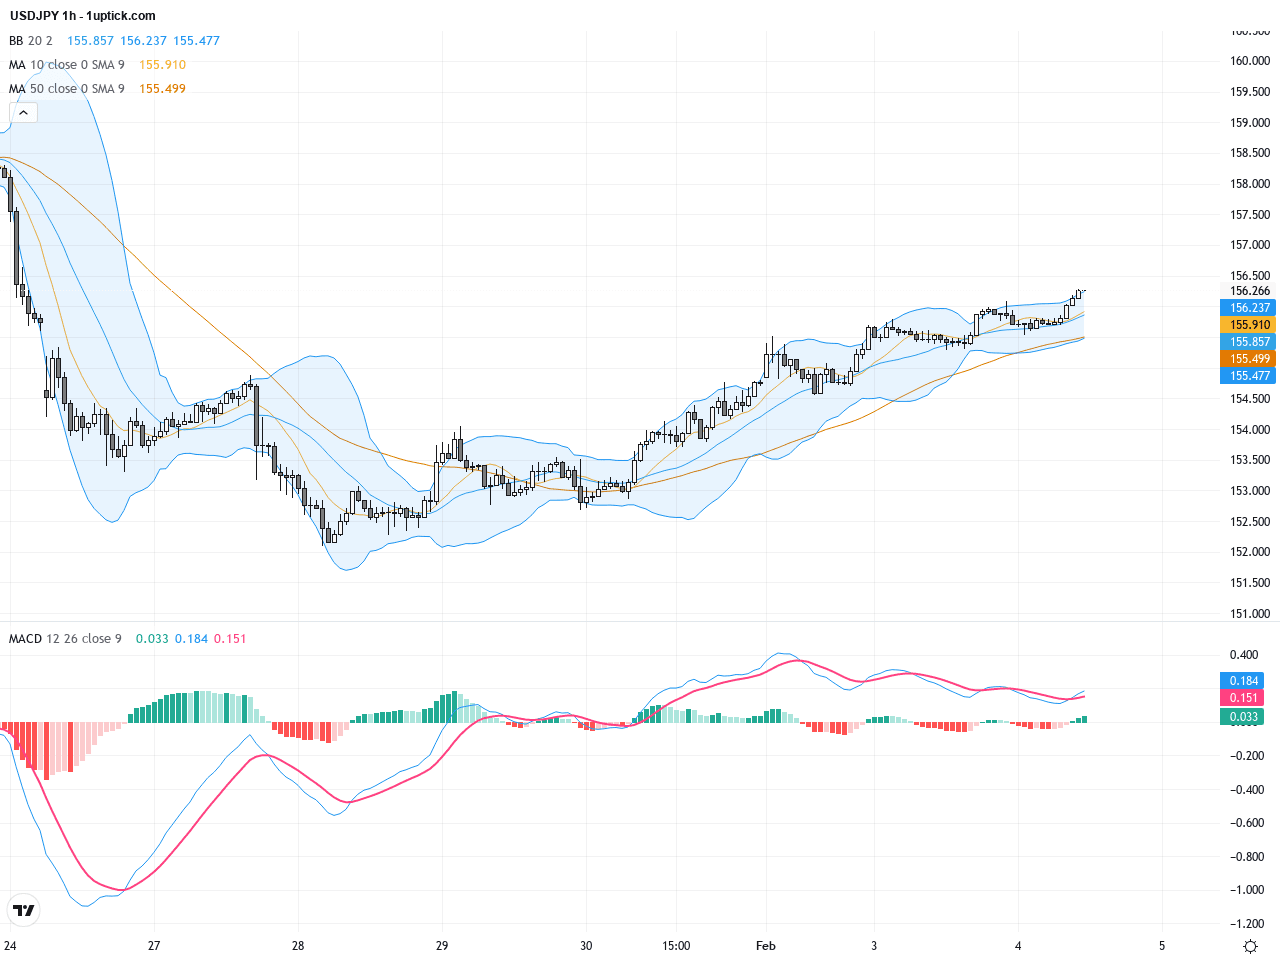
The hourly chart over the past 3-5 days shows USDJPY trading in a 155.50 to 156.30 range before recently breaking above 155.85, reflecting strengthening short-term bullish forces. The 50-hour moving average provides clear support, while Bollinger Bands are expanding alongside the breakout. The MACD has formed a bullish crossover and RSI sits near 65, not yet overbought, suggesting sustained bullish momentum but with potential for short-term retracement. The short-term technical structure favors continued upside movement.
Technical Trend: Decisively Bullish Trend
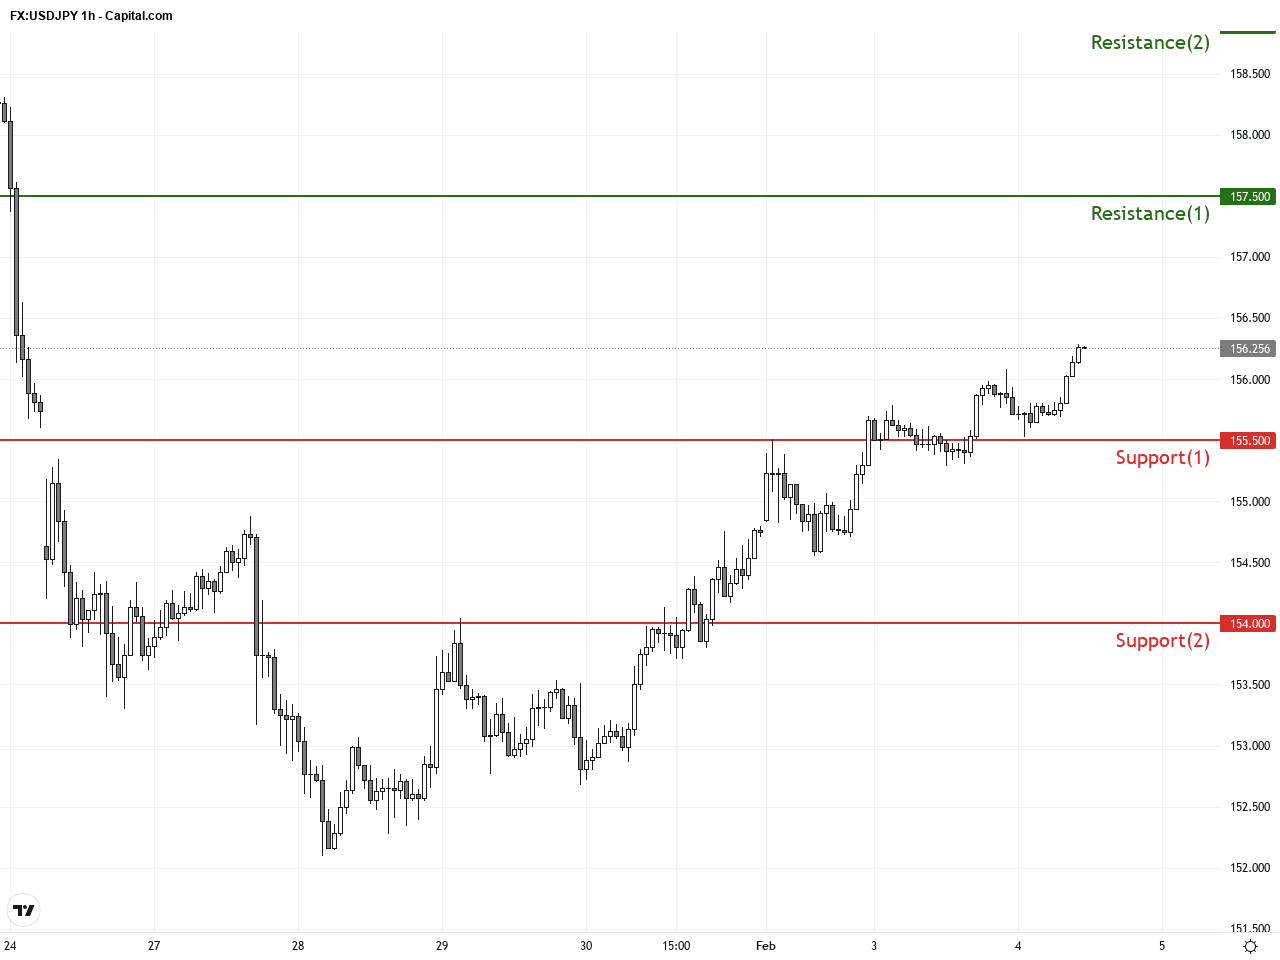
USDJPY is currently breaking out of a flag pattern around the 155.50 level, catalyzed by political uncertainty in Japan. The daily MACD remains strongly bullish with no signs of momentum fading, indicating further upside potential. The hourly chart’s bullish MACD crossover and favorable RSI support near-term buying interest. The expanding daily Bollinger Bands suggest increased volatility, so traders should watch for potential short-term pullbacks. Key bullish signals include holding above the 50-day moving average and recent bullish engulfing candlestick, pointing toward upside targets beyond 157.Today’s economic calendar contains no significant events directly impacting the Japanese yen or USDJPY pair. While various European countries release services PMIs and inflation data, these hold limited influence on USDJPY. Therefore, today’s price moves are likely to be driven more by market sentiment and technical factors rather than fundamental economic releases.
Resistance & Support
The above financial market data, quotes, charts, statistics, exchange rates, news, research, analysis, buy or sell ratings, financial education, and other information are for reference only. Before making any trades based on this information, you should consult independent professional advice to verify pricing data or obtain more detailed market information. 1uptick.com should not be regarded as soliciting any subscriber or visitor to execute any trade. You are solely responsible for all of your own trading decisions.