


 |
| Gold V.1.3.1 signal Telegram Channel (English) |
EURUSD-Daily
2025-09-10 @ 15:36
Market Overview
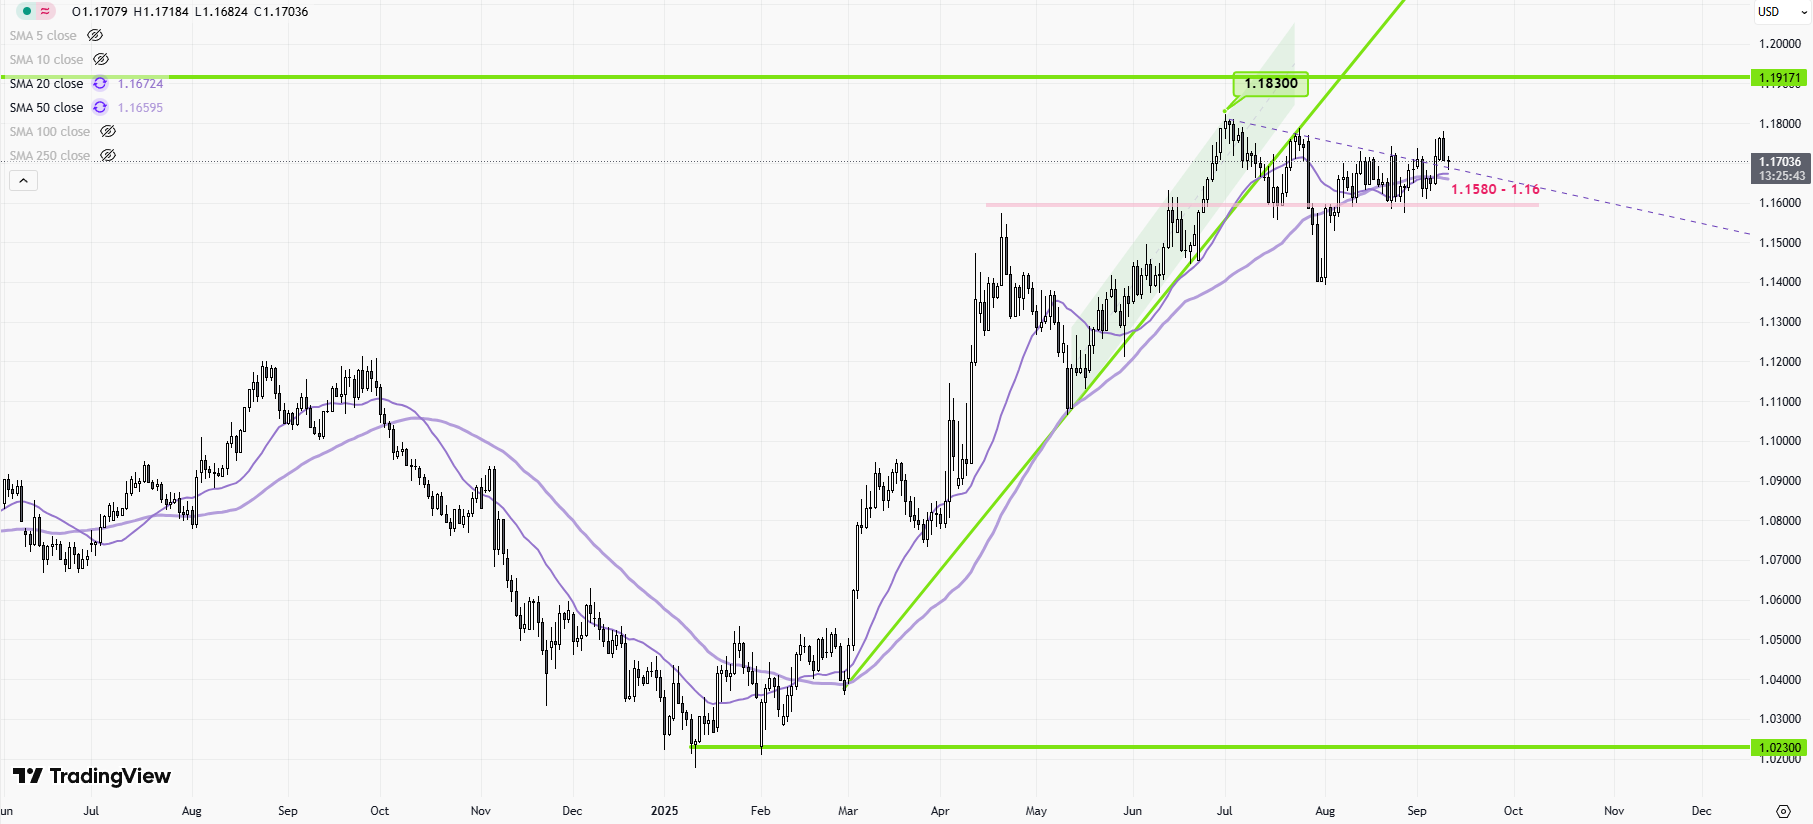
EURUSD has experienced notable volatility in the past week, with prices climbing above 1.1700 and reaching highs near 1.1800 before facing resistance. The uptrend started after weaker-than-expected US labor market data fueled expectations for a Federal Reserve rate cut, weakening the dollar and supporting the euro. However, the pair faced pullbacks sparked by renewed geopolitical tensions and market caution ahead of key data releases. Resistance around 1.1735, aligned with the 78.6% Fibonacci retracement of the July decline, has capped gains, leading to potential short-term consolidation. Upcoming European Central Bank and US inflation data remain critical drivers for the pair’s direction.
The EUR/USD daily chart currently displays a decisive bullish structure, underpinned by notable technical patterns and indicator signals. Here’s a thorough breakdown and actionable technical analysis:
Current Chart Analysis:
1. Trend Direction
– The EUR/USD pair is in a clear uptrend since early 2025, establishing higher highs and higher lows. The price has moved above significant resistance from the July and August swing highs and is now testing a year-to-date zone near 1.1800-1.1830.
2. Chart Patterns
– A prominent inverse head-and-shoulders pattern is visible, completed recently with price action moving above the neckline. This classic reversal pattern signals a shift from medium-term bearishness to bullishness, with an implied target in the 1.2000 area based on the vertical height of the pattern.
- There is no evidence of a Double Top, Double Bottom, or traditional Triangle patterns on the current daily timeframe.
3. Candlestick Patterns
– Recent daily bars include several long-bodied bullish candles, reflecting strong buying momentum.
– Some recent candles may be interpreted as bullish engulfing patterns, especially around the breakout above 1.1700, signaling further upside conviction.
– There are no significant Doji or Hammer candles in the immediate recent activity, suggesting conviction rather than indecision dominates.
4. Support and Resistance Levels
– Key support: 1.1700, 1.1680, 1.1650, 1.1590. Closing back below 1.1700 would be an early warning of bullish fatigue.
– Key resistance: 1.1780, 1.1830, and psychological 1.2000. Above 1.1830, momentum may accelerate toward 1.2000, which acts as a major confluence.
– Notably, 1.1830 acted as a year-to-date high and is critical for further bullish continuation.
5. Implied Technical Indicators & Signals
– Although the attached chart does not display indicators, price action suggests the following:
– Moving Averages: Price is almost certainly trading well above the 50-day and 200-day moving averages, confirming the uptrend and underlying bullish structure, with a likely recent golden cross.
– RSI (Relative Strength Index): Momentum is robust and likely pushing RSI near or slightly above 70, indicating strong bullish momentum with potential for short-term overbought conditions.
– MACD: Likely bullish and widening, given the sustained up-leg and momentum.
– Bollinger Bands: Price is near or at the upper band, indicating volatility expansion and trend strength. However, persistent upper-band riding is common during bullish runs and does not itself imply reversal.
6. Volume and Momentum Insights
– While not directly shown, momentum is very strong, with rapid advances through resistance zones and little evidence of distribution or profit taking yet. Volume, if available, would likely confirm this with bursts on breakout days.
Actionable Technical Outlook:
- Bias: Strongly bullish; uptrend is intact with recent breakout and inverse head-and-shoulders completion confirming the momentum.
- Key levels to watch: As long as EUR/USD holds 1.1700 on a daily closing basis, bulls remain in control. A daily close above 1.1830 confirms breakout and opens space for a run toward 1.2000. Any move back below 1.1700-1.1680 would suggest bull exhaustion or the start of corrective action.
-
Potential setups: Momentum traders may look for pullbacks toward support (1.1720-1.1700) as buying opportunities, targeting 1.1830 then 1.2000. Aggressive breakout traders may consider entries on a confirmed close above 1.1830.
-
Risks: The trend is extended and RSI is likely in overbought territory, so be prepared for short-term corrective moves or increased volatility around key events (ECB, US CPI).
Summary:
EUR/USD exhibits a robust bullish technical outlook, propelled by confirmed upside patterns and momentum. As long as the pair holds above the 1.1700 zone, bulls are favored with upside targets at 1.1830 and 1.2000. Caution is warranted if price reverses back below current support, but for now, the setup supports trend-following strategies and further gains.