


 |
| Gold V.1.3.1 signal Telegram Channel (English) |
USDJPY: Technical and Fundamental Insights Highlight Key Resistance and Rate Expectations
2025-12-22 @ 08:01
Over the past 24 to 48 hours, the USD/JPY pair softened, sliding from yesterday’s close at 157.625 to around the 157.50 mark. Market sentiment has been influenced by growing expectations of a potential rate cut by the US Federal Reserve, putting pressure on the dollar and pushing the USD/JPY rate lower.
The Bank of Japan (BoJ) recently raised interest rates to 0.75%, the first hike in decades, which caught some investors off guard and provided some support to the yen. However, this was not enough to fully offset the dollar’s weakness. The BoJ’s cautious and conservative approach aims to manage domestic inflation while maintaining market stability, leading to a cautious consolidation in forex markets.
For the average investor, the recent USD/JPY fluctuations reflect the diverging monetary policies among major central banks: the Fed leans toward easing while the BoJ tightens. This creates a short-term scenario where the dollar is under stress, while the yen stands to benefit from rising rates. Keeping a close watch on upcoming central bank announcements will be key to understanding the next moves in this currency pair.

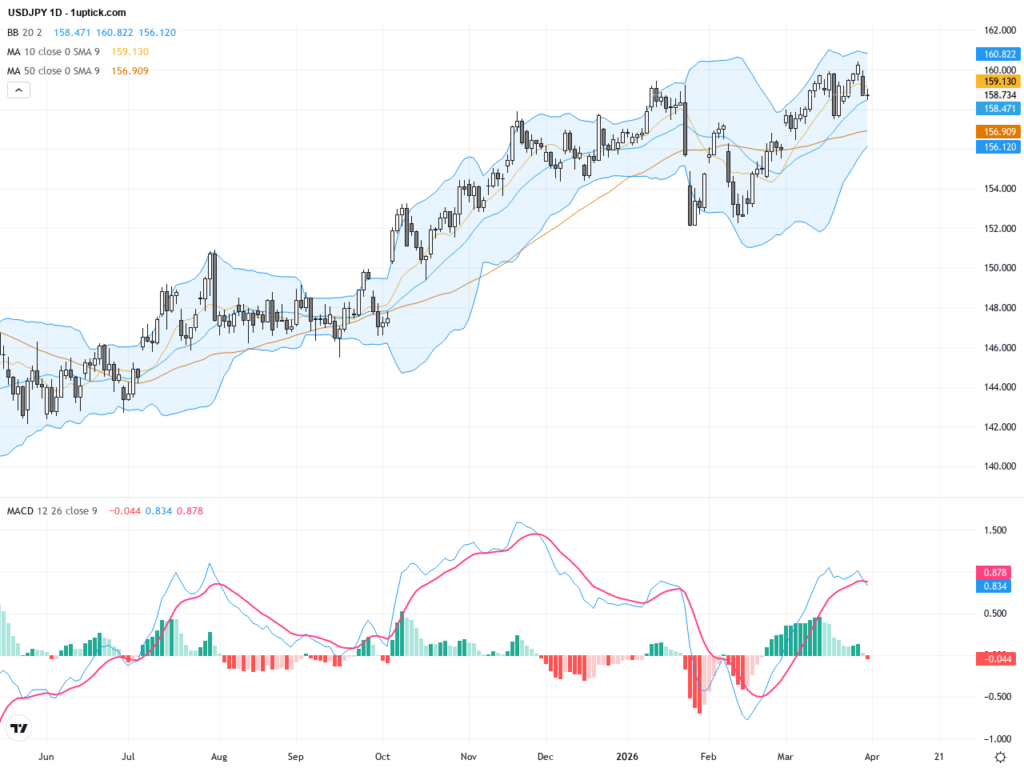
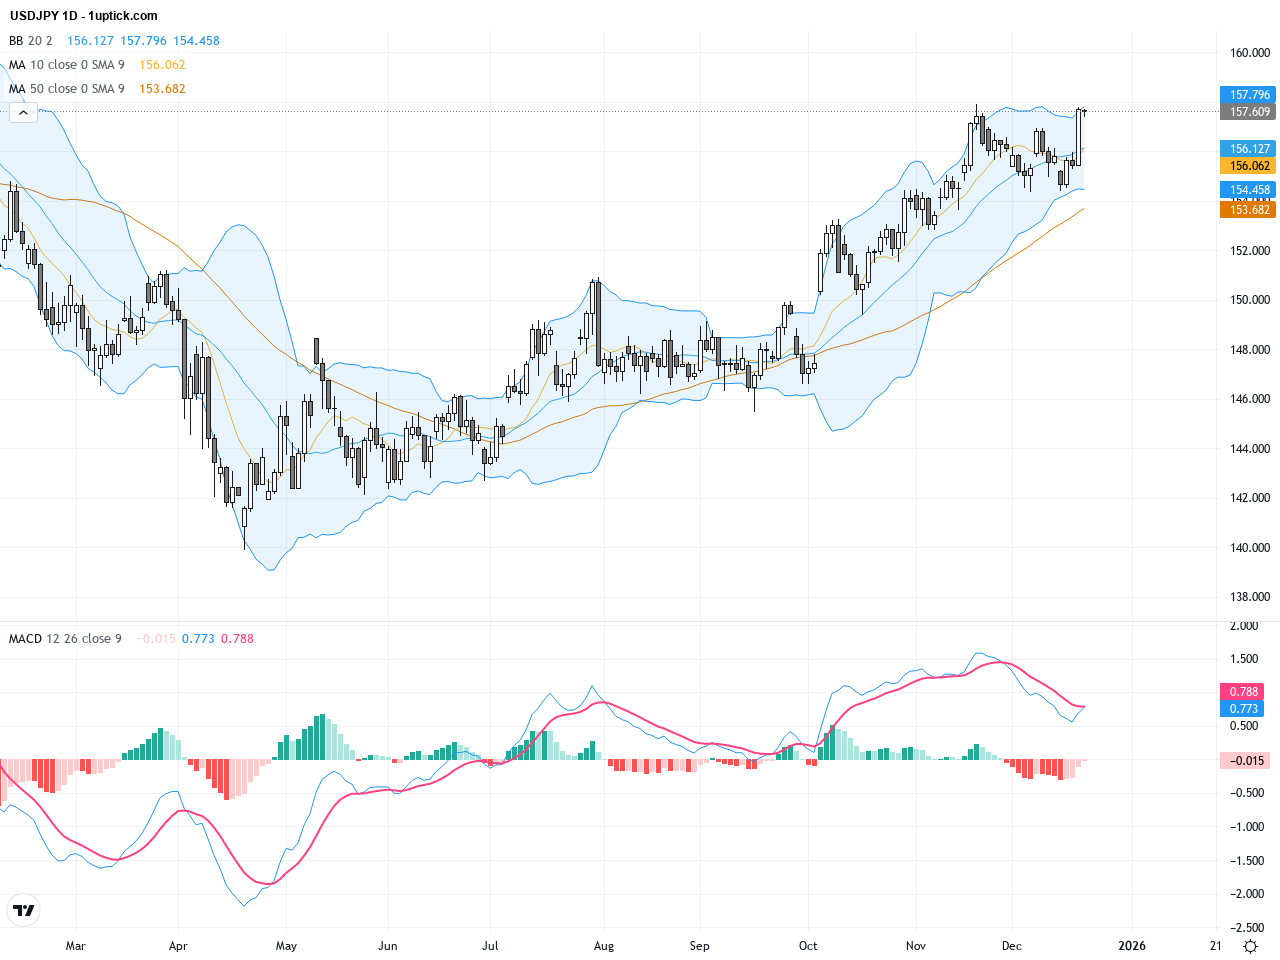
The daily chart reveals a strong uptrend in USDJPY, ascending steadily from the year’s low of 139.89. The price has surpassed both the 50-day EMA (~154.31) and the 200-day EMA (~148.49), supporting a long-term bullish setup. Bollinger Bands are widening, indicating increased volatility, with prices frequently touching the upper band but without substantial pullback, signaling strong buying pressure. The MACD histogram shows expanding bullish momentum, accompanied by slight increases in volume, indicating trend continuation.
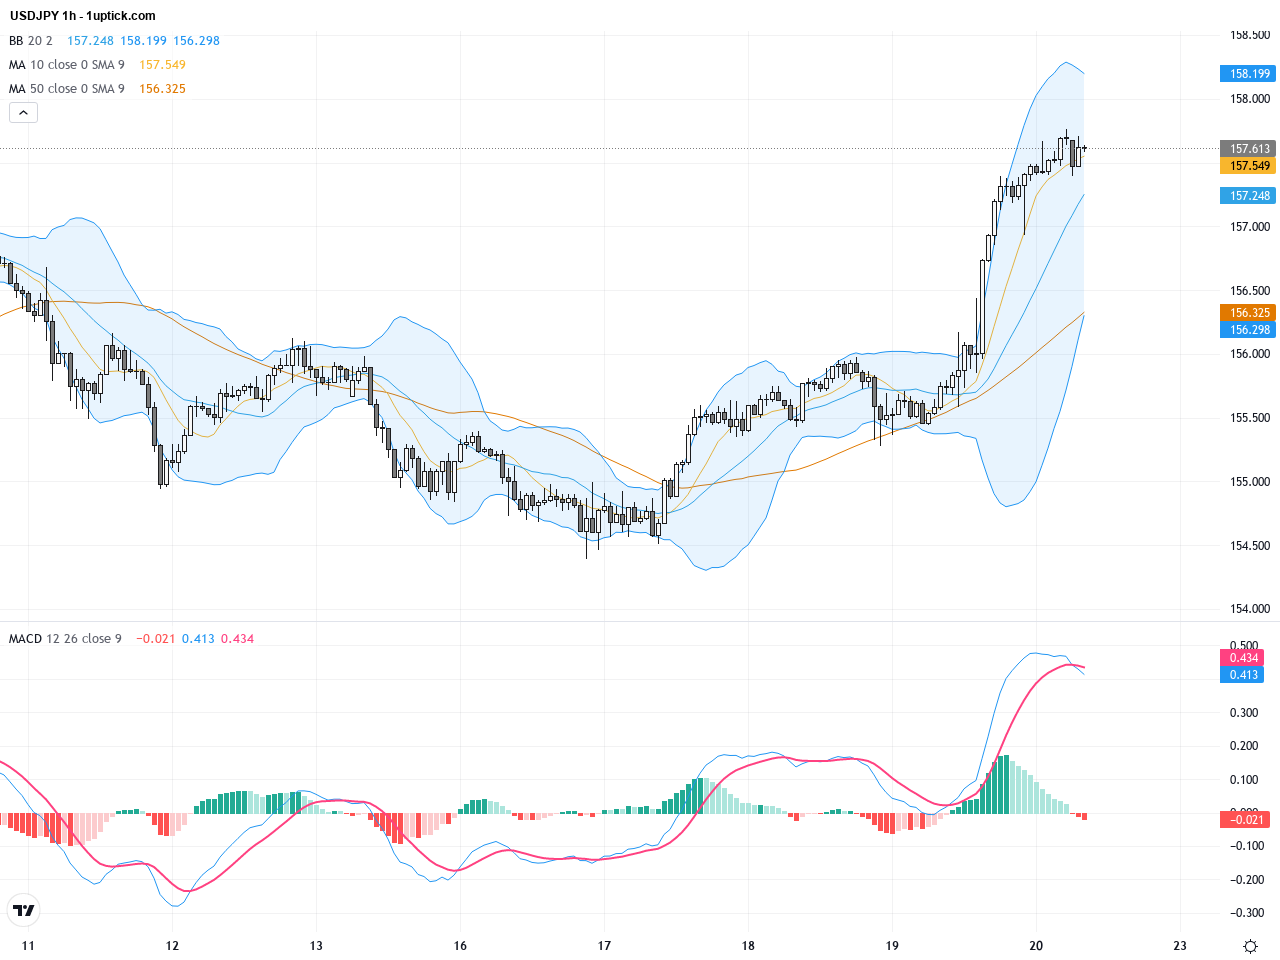
The hourly chart over the past 3-5 days shows consolidation between 157 and 157.75. The short-term DMA crossover formed a bearish signal recently, cautioning about potential pullbacks. Bollinger Bands have narrowed, indicating range-bound movement. MACD momentum is decreasing, with histogram bars shrinking, suggesting a possible short-term correction. If USDJPY holds above 157.30 support, a rebound could occur; failing that, watch for possible tests of 156.80 support.
Technical Trend: Short-term sideways volatility, mid-term bullish trend continuation with cautious optimism.
Technical indicators highlight USDJPY in a cautious consolidation phase. The daily chart maintains a bullish trend, but the hourly chart warns of near-term correction risks. With shrinking MACD bullish histogram and a critical support at 157.30, a breach could trigger a pullback towards 156.80. Resistance at 157.75 is key; a breakout here may lead to a test of the yearly highs. Fundamentally, the interest rate differential driven by US Fed and BoJ policies favors the USD, though short-term market caution persists.Today’s GMT+1 economic calendar lacks major events directly affecting USDJPY. Recent Bank of Japan decisions and Federal Reserve speculation have already impacted price. Other releases from China, UK, and Nordic countries are unlikely to cause significant USDJPY moves today. Traders should focus on upcoming key US and Japanese economic indicators for potential market shifts.
Resistance & Support

The above financial market data, quotes, charts, statistics, exchange rates, news, research, analysis, buy or sell ratings, financial education, and other information are for reference only. Before making any trades based on this information, you should consult independent professional advice to verify pricing data or obtain more detailed market information. 1uptick.com should not be regarded as soliciting any subscriber or visitor to execute any trade. You are solely responsible for all of your own trading decisions.