


 |
| Gold V.1.3.1 signal Telegram Channel (English) |
USDJPY Trading Outlook: Price Pressured Below 155 with Key Technical Patterns Emerging
2025-12-08 @ 08:01
Over the past 24 to 48 hours, the USD/JPY pair exhibited a volatile downward trend, closing around 155.302 yesterday, slightly lower than the previous trading day. Market attention focused on the looming Federal Reserve rate cut expectations and escalating military tensions between Japan and China, two major factors pressuring the USD against the JPY, pushing the pair near 155.25.
Specifically, uncertainty surrounding the Fed’s future rate policy has cast doubts on the dollar’s sustained strength, while rising geopolitical risks in East Asia have intensified bets on a stronger yen. Additionally, rising Japanese government bond yields have raised concerns among investors about possible capital shifts and market volatility, keeping USD/JPY under pressure and limiting its upside.
For the average investor, this market environment is like driving in an approaching storm — requiring readiness for sudden shifts. When major central bank policies and geopolitical risks heighten, currency pairs tend to experience increased volatility, reminding investors to manage risks carefully and to closely monitor global macroeconomic and political developments for more informed investment decisions.

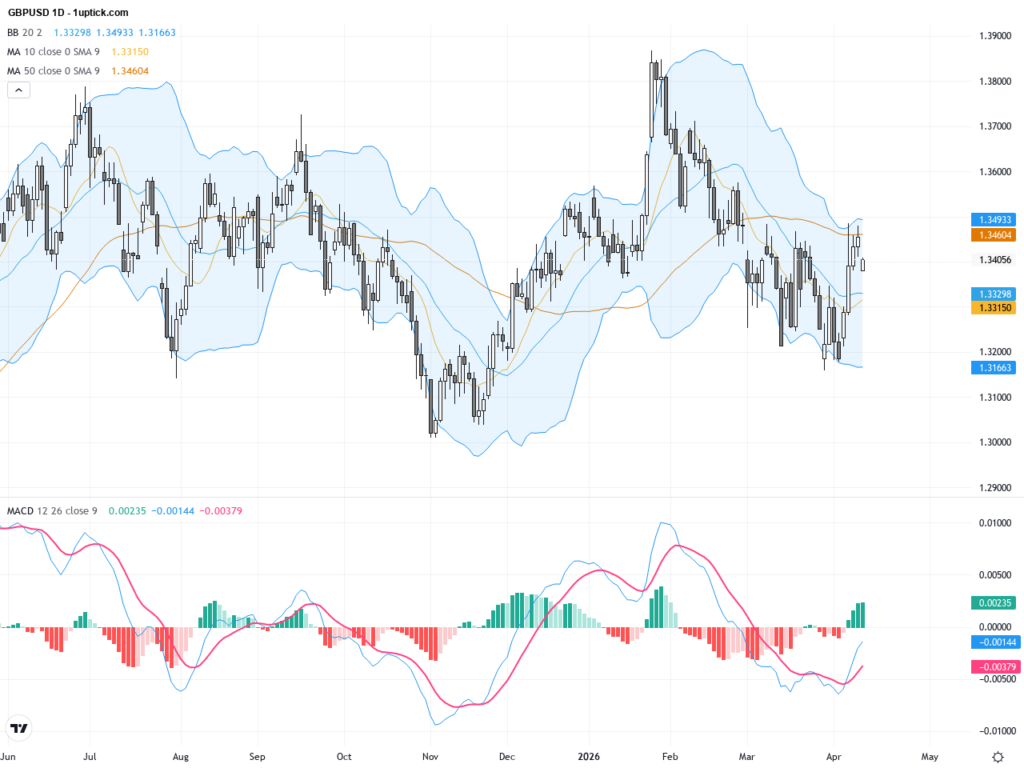
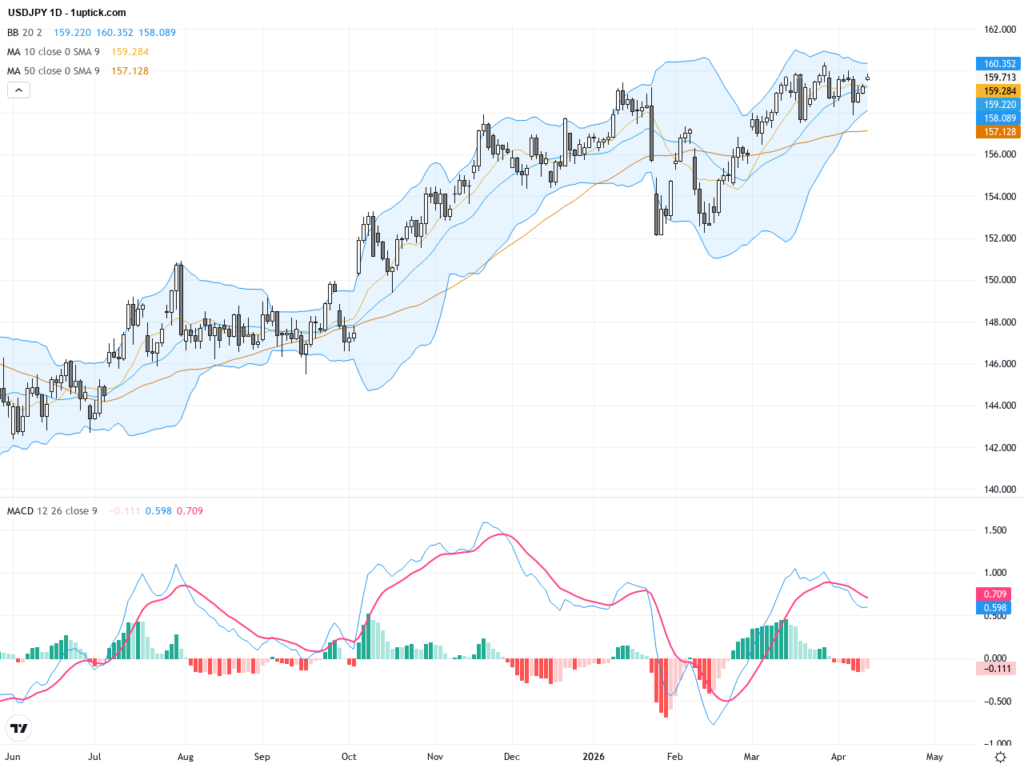
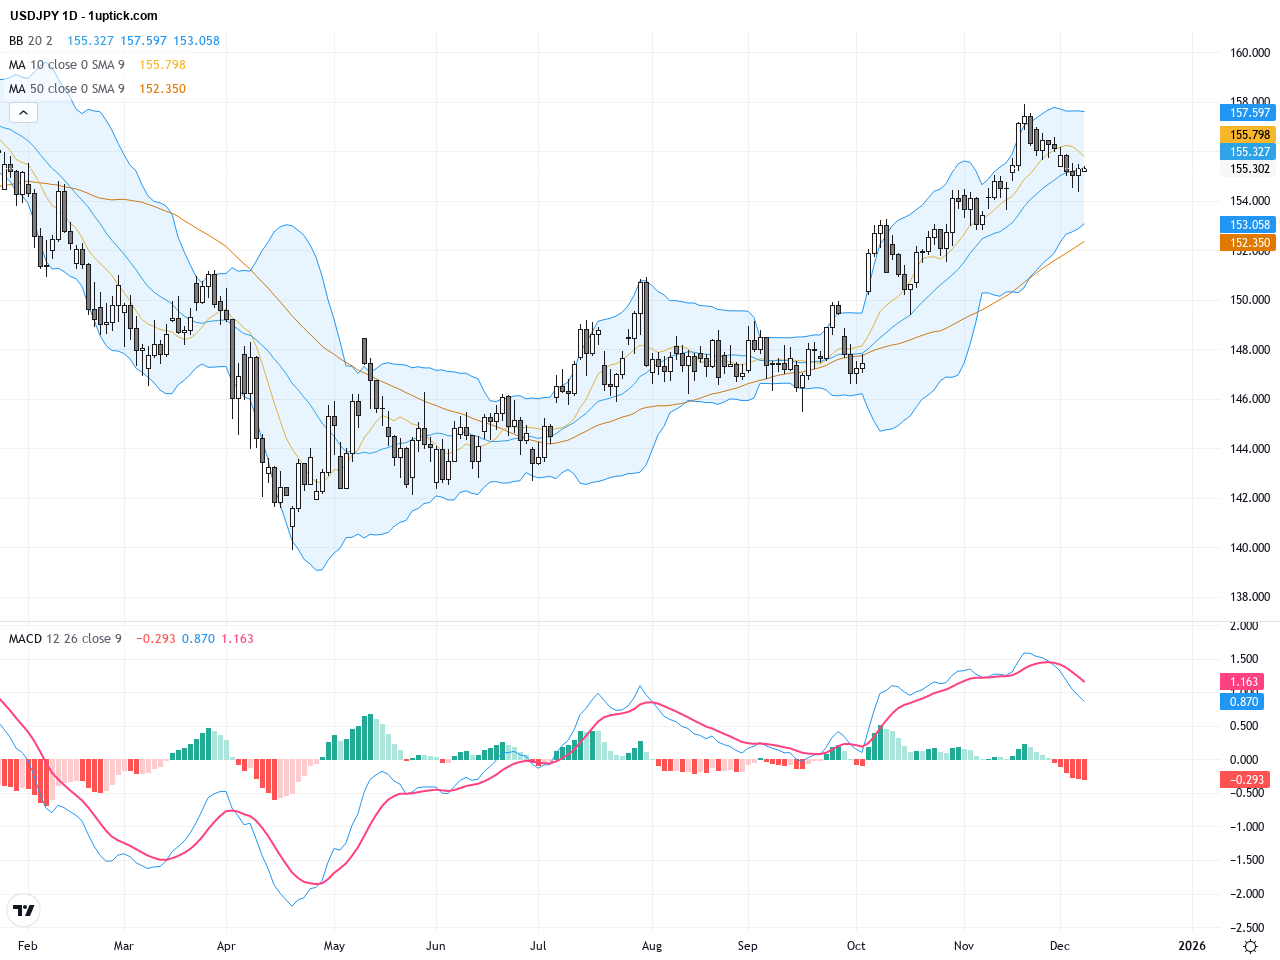
The USDJPY daily chart shows a retracement from the yearly high of 158.87, with price seeking support near the key 155 psychological level. The 50-day moving average at 153.97 and 200-day moving average at 148.40 remain upward-sloping, indicating a medium to long-term bullish bias. However, the MACD histogram shrinking signals waning momentum. The narrowing Bollinger Bands suggest consolidating price action, foreshadowing a possible upcoming breakout. Overall, the daily chart is in a corrective phase, awaiting directional confirmation.
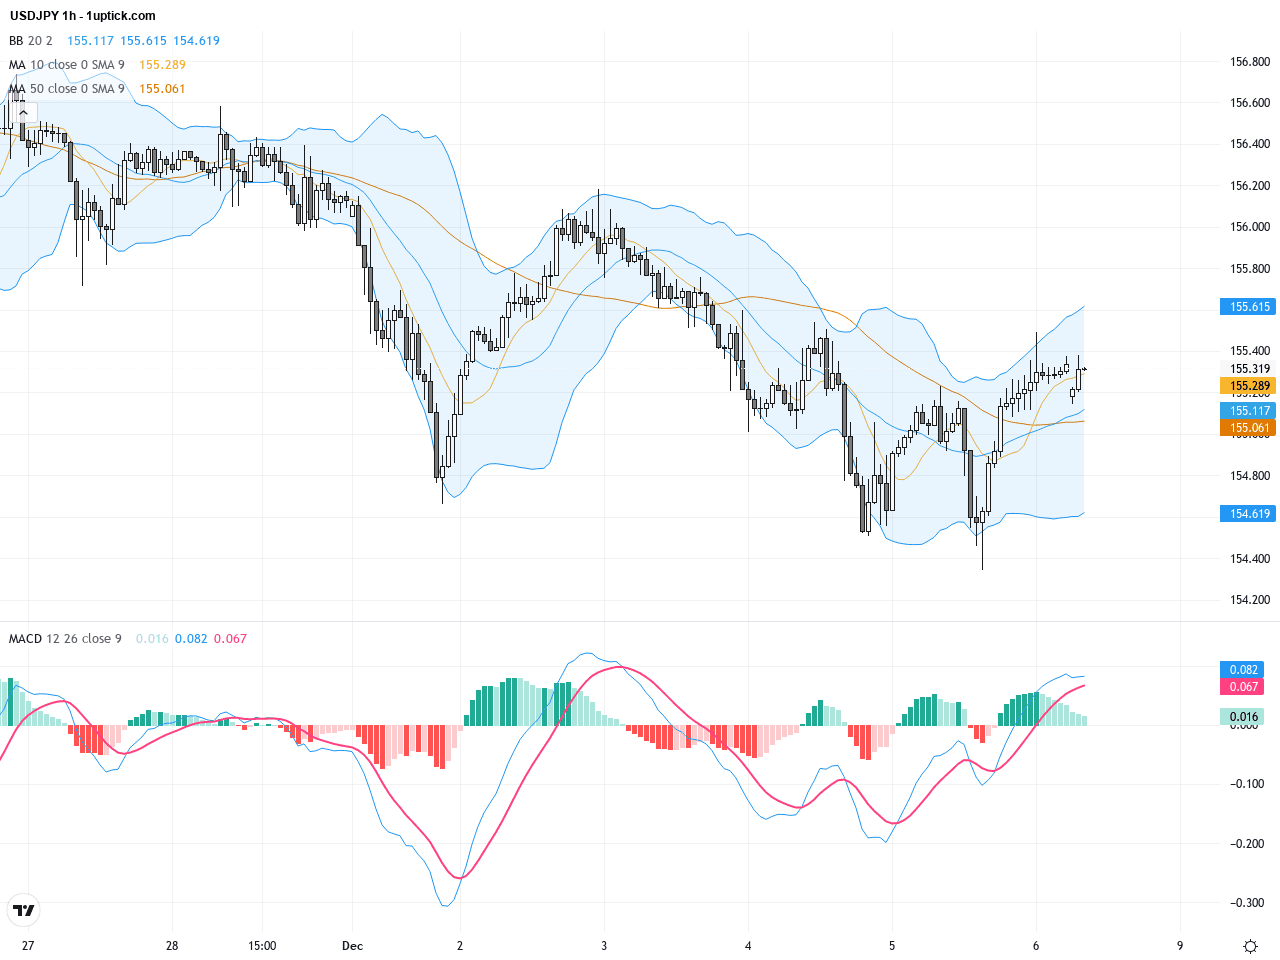
On the hourly chart, USDJPY has been under clear resistance near 155.50 over the past 3-5 days, failing multiple attempts to break higher and oscillating around the 155 level. The MACD has formed a bearish crossover recently and slight declines in the RSI suggest strengthening short-term bearish momentum. Bollinger Bands have contracted with prices testing the lower band repeatedly, implying potential downside risk in the near term. Traders should watch volume and momentum indicators closely for signs of trend continuation or reversal.
Technical Trend: Cautiously Bearish
From a technical perspective, USDJPY is forming a medium-term descending triangle pattern, initiated near the 155.50 resistance level, indicating possible continuation of the recent downtrend. The daily chart’s bearish engulfing candle following a prior bullish pattern signals short-term sellers gaining control. The MACD bearish crossover on the hourly chart adds weight to bearish sentiment. Traders should watch support levels carefully and look for volume confirmation to identify potential rebound opportunities or further declines.Japan will release its finalized third-quarter GDP and October current account data at 00:50 GMT+1 (08:50 HKT). The market consensus forecasts a GDP downturn from 2.3% to -2% annualized. Should the data meet or underperform expectations, it would likely weaken the Yen further and support USDJPY gains. Conversely, a better-than-expected outcome could spur Yen strength and push USDJPY lower. No other significant USD-related economic events are scheduled today. Traders should monitor these Japanese economic releases closely for immediate market impact.
Resistance & Support

<
p style=”padding: 10px; margin: 20px 0; border: solid 1px #fa003f; border-radius: 5px;”>The above financial market data, quotes, charts, statistics, exchange rates, news, research, analysis, buy or sell ratings, financial education, and other information are for reference only. Before making any trades based on this information, you should consult independent professional advice to verify pricing data or obtain more detailed market information. 1uptick.com should not be regarded as soliciting any subscriber or visitor to execute any trade. You are solely responsible for all of your own trading decisions.