


 |
| Gold V.1.3.1 signal Telegram Channel (English) |

GBPUSD Breaks Above Key 1.3500 Resistance – Trading Outlook and Technical Patterns Insight
2026-01-23 @ 13:01
Over the past 24 to 48 hours, GBP/USD demonstrated notable volatility but largely remained near yesterday’s closing price of 1.34971. The pair fluctuated between 1.3484 and 1.35085 as markets reacted to significant political and economic developments.
Key drivers behind the recent price movements included a policy pivot by U.S. President Donald Trump, which boosted market optimism around European trade relations and geopolitical risk, particularly following his softened stance on Greenland that led to a broad selloff of the U.S. dollar and supported the British pound. Furthermore, Japan’s December Consumer Price Index (CPI) rose by 2.1% YoY, adding indirect pressure on global central bank policies. Meanwhile, UK data releases such as retail sales and PMIs remain closely watched short-term catalysts.
For the everyday investor, the recent GBP/USD price action can be seen as a clash of politics and economics shaping currency value. Trump’s change in tone has momentarily eased concerns over US-European and Asia-Pacific trade tensions, giving the pound a lift; however, uncertainty lingers over whether UK’s domestic economic data will sustain this rebound. The upcoming retail sales and PMI numbers could act as pivotal forces for the next phase of the pair’s movement.

The daily chart shows that GBPUSD has been in a steady uptrend recently, trading above the 50-day moving average (~1.33913) and the 200-day moving average (~1.34102), indicating a sustained medium to long-term bullish setup. The Bollinger Bands are widening, suggesting increased volatility. The MACD remains positive though its histogram shows some slowdown, implying a potential short-term pause. Overall, the daily trend confirms a breakout above key moving averages consolidating around the 1.3450 level, supporting a bullish market bias.
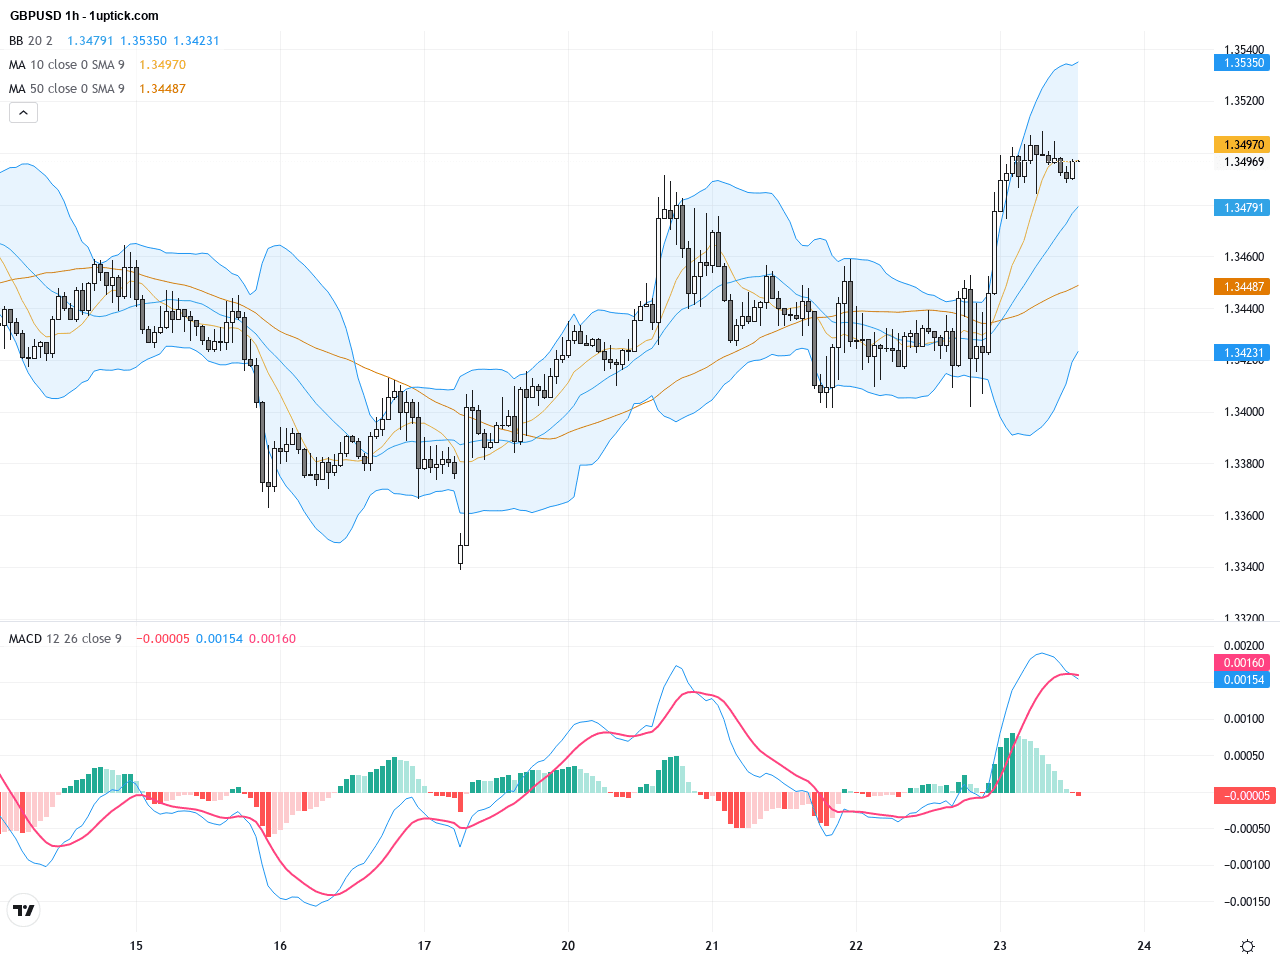
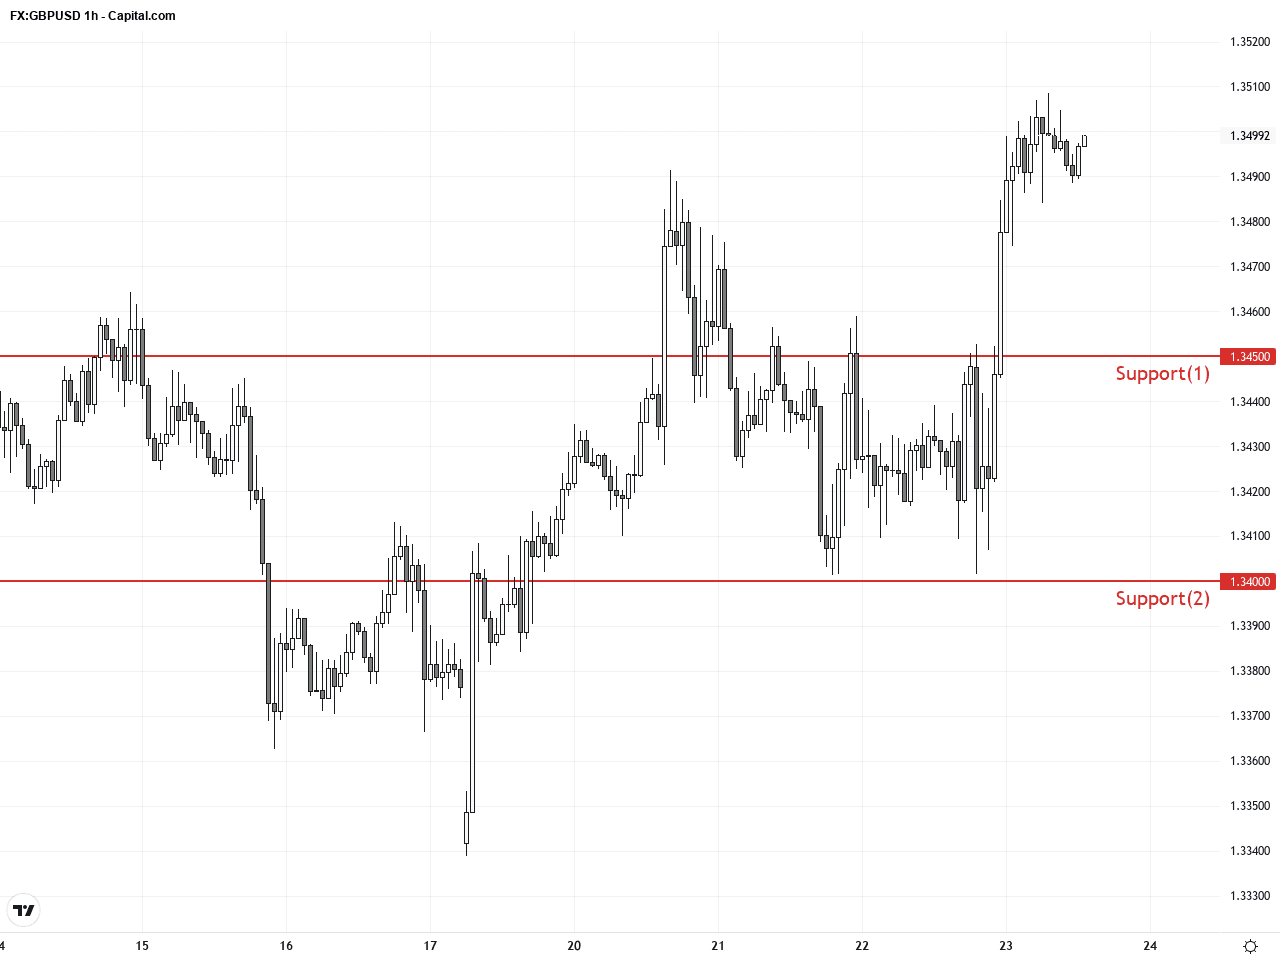
On the hourly chart over the past 3 to 5 days, GBPUSD has exhibited a steady upward movement, breaking through the 1.3500 psychological level. The short-term moving averages have crossed above the longer-term ones, giving a buy signal. Price action is near the upper Bollinger Band, indicating potential for a brief pullback. MACD has formed a bullish crossover near the zero-line, reinforcing the upward momentum. Notably, a bullish engulfing candlestick pattern signals likely strength for the next 24 hours.
Technical Trend: GBPUSD currently exhibits a cautiously bullish short-term trend with moderate volatility.
The most critical technical insight for GBPUSD is the bullish alignment of moving averages on both daily and hourly charts, alongside a breakout above the 1.3500 psychological resistance. The daily Bollinger Bands expansion suggests heightened volatility, warranting caution for short-term corrections. The recent bullish engulfing candle supports sustained upside momentum. Additionally, the MACD bullish crossover adds confidence for further gains. Trading volume remains moderate but price holding above key moving averages indicates institutional buying interest fueling the uptrend.Today’s key economic data include Japan’s December Consumer Price Index (CPI) and Core CPI, with readings at 2.1% and 2.4% year-on-year respectively, matching forecasts. While important, these events have limited direct impact on GBPUSD. The focus will be on the UK’s December retail sales release at 08:00 local UK time, with expectations of 1% YoY growth and flat month-on-month. Retail sales results may directly influence GBPUSD price moves, where a miss could weigh on the pound. Therefore, UK retail sales represent the most relevant economic event for GBPUSD traders today.
Resistance & Support
The above financial market data, quotes, charts, statistics, exchange rates, news, research, analysis, buy or sell ratings, financial education, and other information are for reference only. Before making any trades based on this information, you should consult independent professional advice to verify pricing data or obtain more detailed market information. 1uptick.com should not be regarded as soliciting any subscriber or visitor to execute any trade. You are solely responsible for all of your own trading decisions.