


 |
| Gold V.1.3.1 signal Telegram Channel (English) |
AUDUSD Technical & Fundamental Analysis: Four-Year Highs Signal Strong Bullish Momentum, May 11, 2026
2026-05-11 @ 06:01
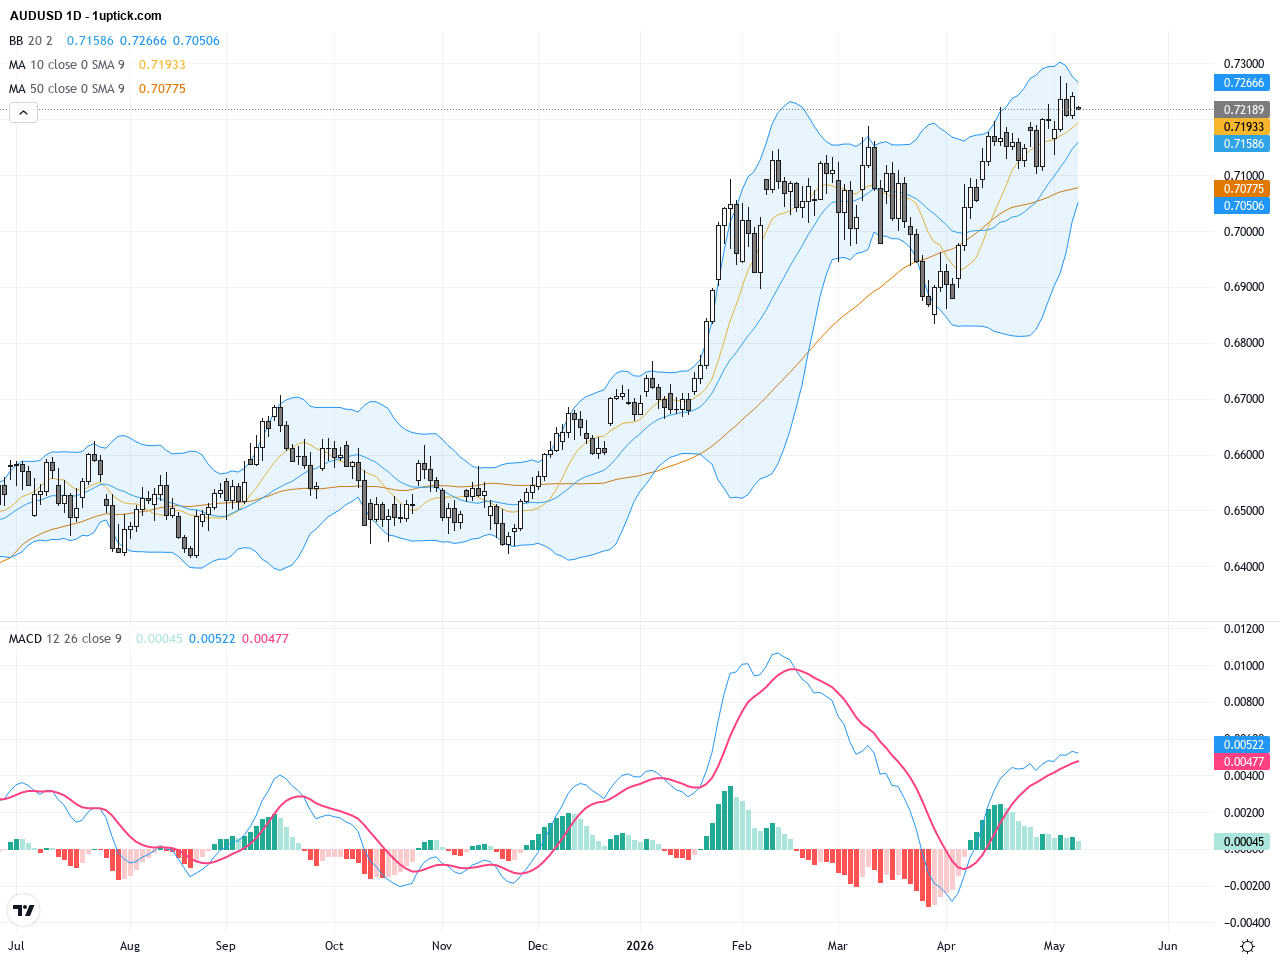
Over the past 24 to 48 hours, the Australian dollar against the US dollar (AUD/USD) has shown robust performance, closing yesterday at 0.72178, near a near three-year high. This strength was largely driven by increased investor risk appetite, bullish futures positioning, and optimism ahead of the Trump-Xi summit.
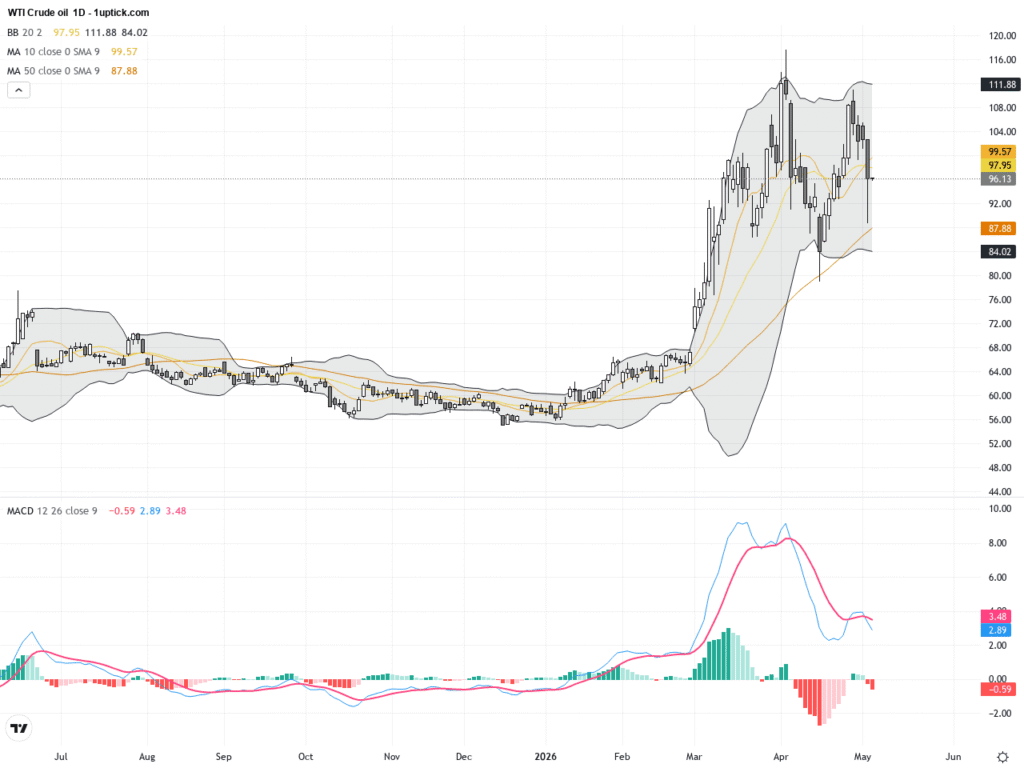
The Reserve Bank of Australia’s relatively hawkish interest rate stance, combined with oil-driven inflation risks and China’s sluggish recovery, has added complexity to AUD/USD’s outlook. Additionally, movements in Japanese government bonds, US Treasury yields, and volatile energy prices globally have indirectly influenced the pair’s fluctuations.
For the average investor, the recent market move can be seen as a high-stakes race where the Aussie, as a risk-sensitive asset, surged rapidly in response to global economic news and geopolitical developments. The AUD/USD climbing above the 0.72 level emphasizes the market’s enduring appetite for risk in the short term.
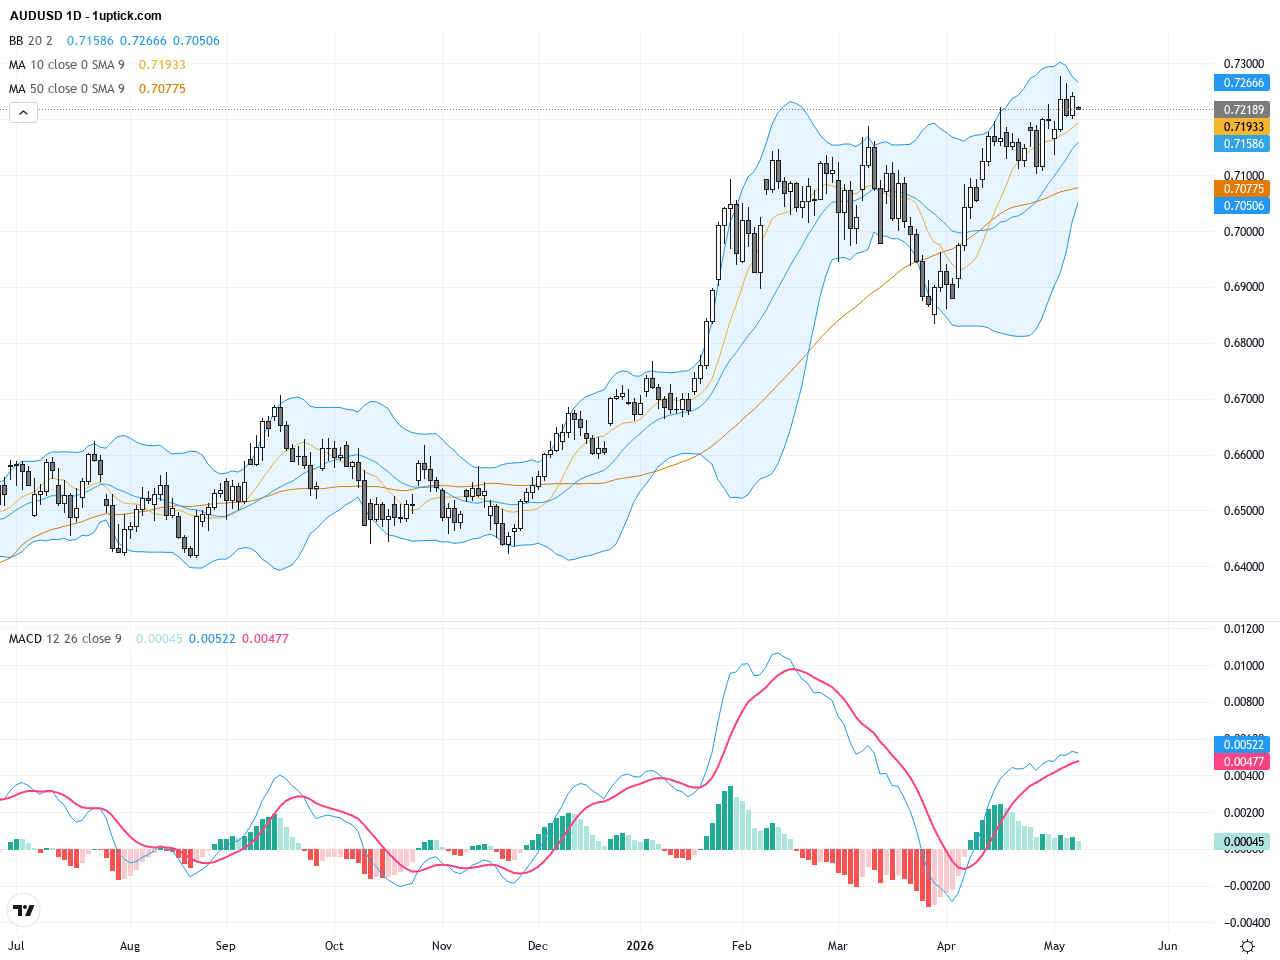
The daily chart reveals a steady upward trend since early May, with AUDUSD price breaking above several resistance levels marked by key moving averages. The 50-day moving average sits comfortably above the 200-day, confirming a strong bullish trend. Bollinger Bands are expanding, signaling increased volatility favoring upside momentum. MACD exhibits a golden cross, reinforcing strong buying pressure. Overall, the daily technical picture is decisively bullish.
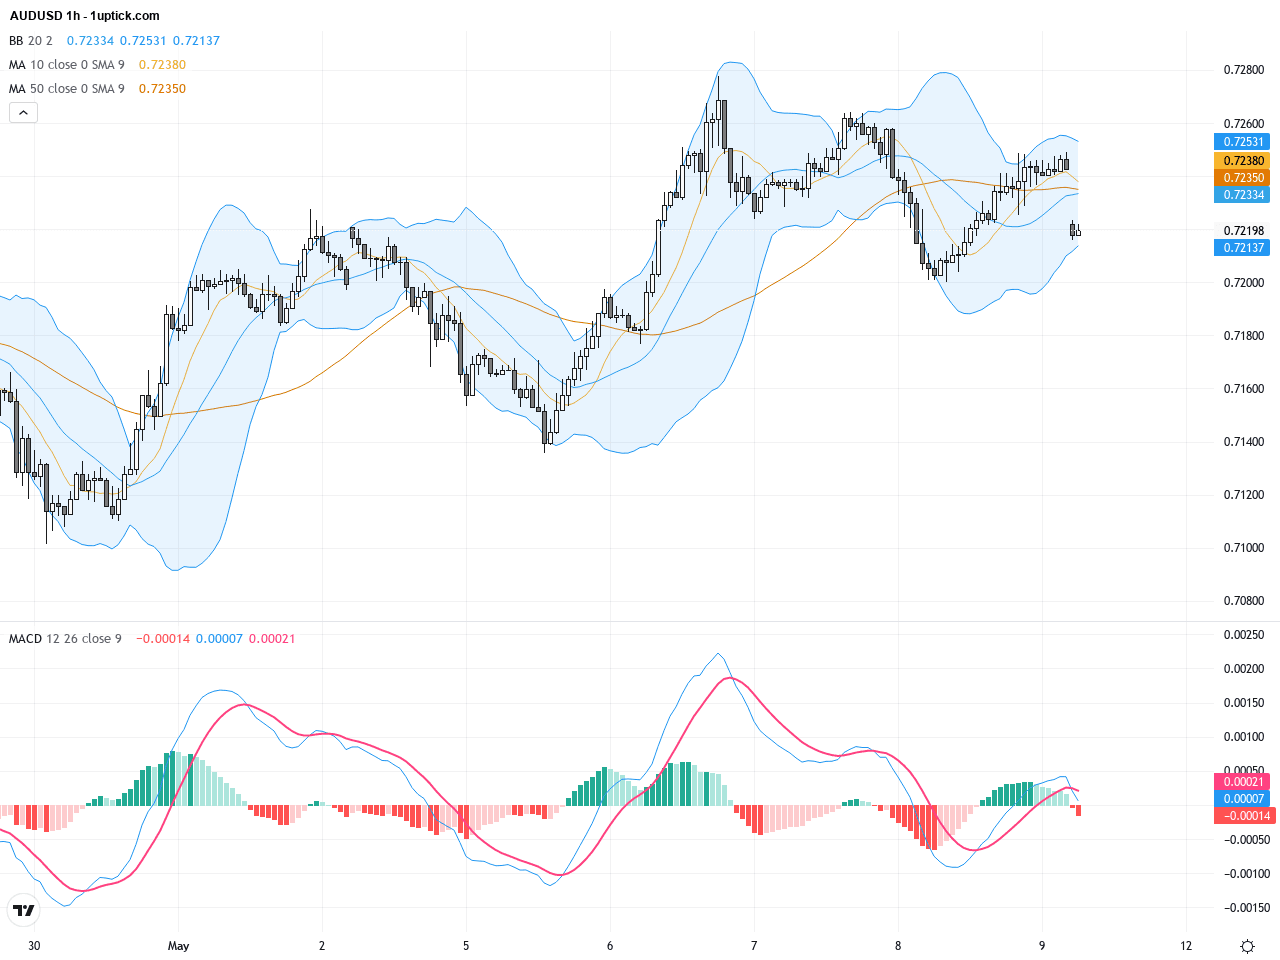
Over the past 3 to 5 days, the hourly chart shows AUDUSD consolidating before breaking out above the 0.7150 support level, initiating a rising flag pattern that began around May 7. Short-term averages (20 and 50 MA) are trending up, indicating bullish control. Bollinger Bands widened after a period of contraction, complemented by a fresh MACD buy signal. A recent shooting star candlestick suggests a minor pullback may occur in the next 24 hours, but the dominant momentum remains upward.
Technical Trend: Decisively bullish trend with strong momentum and supportive volume, indicating continued price appreciation.
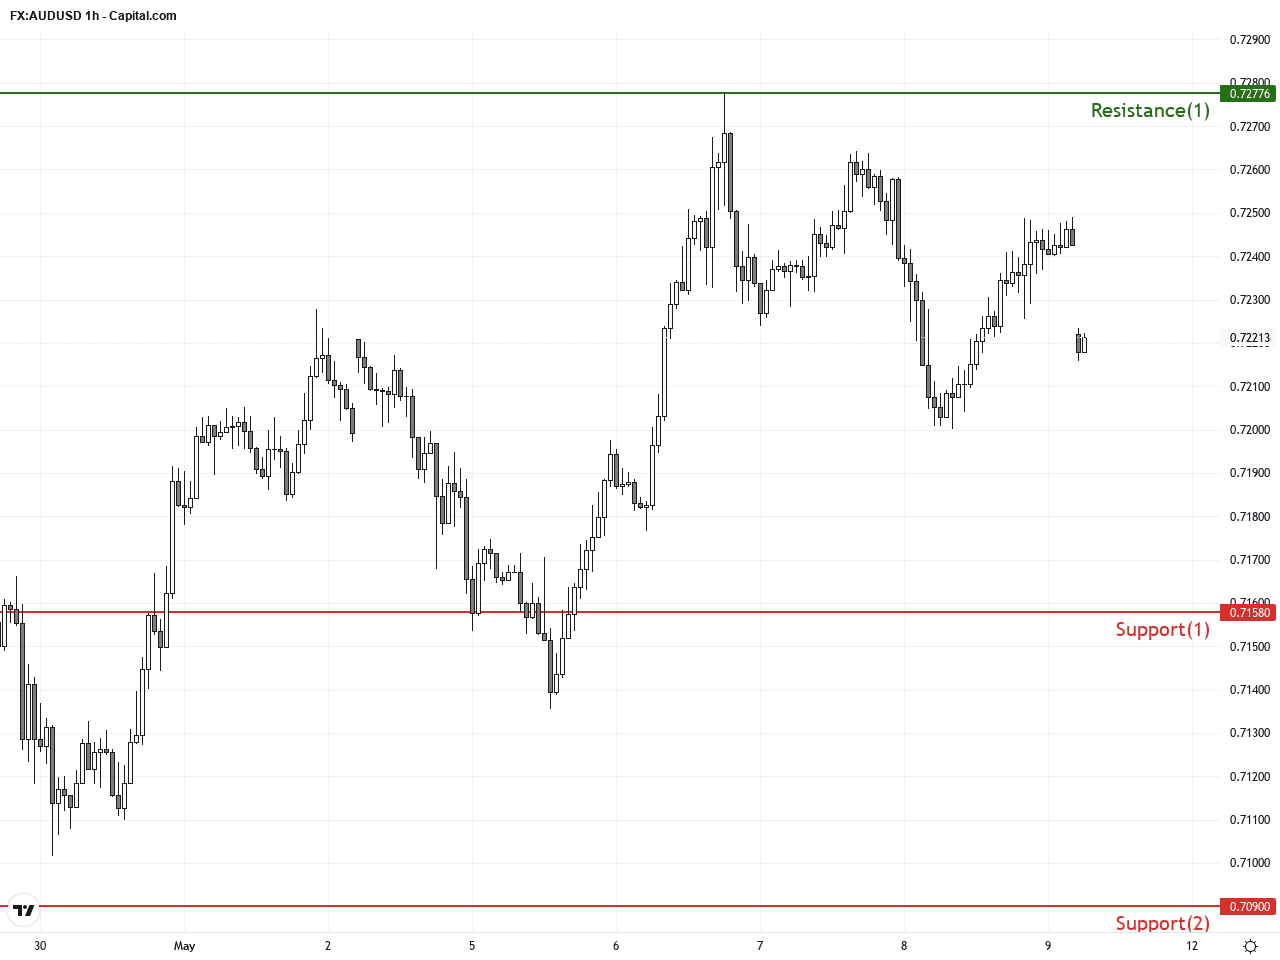
AUDUSD is firmly in a strong bull phase. The daily chart’s moving averages alignment and the MACD golden cross confirm trend continuation. The hourly breakout of the flag pattern and renewed momentum signal a favorable short-term trading opportunity. Though the shooting star candlestick warns of a possible minor retracement, the overall bullish trend remains intact. Key support at 0.7158 should be monitored for downside risk containment.There are no significant or directly relevant economic events scheduled today that would impact AUDUSD. Traders should focus on broader market sentiment and upcoming news developments without immediate data-driven volatility concerns.
Resistance & Support
The above financial market data, quotes, charts, statistics, exchange rates, news, research, analysis, buy or sell ratings, financial education, and other information are for reference only. Before making any trades based on this information, you should consult independent professional advice to verify pricing data or obtain more detailed market information. 1uptick.com should not be regarded as soliciting any subscriber or visitor to execute any trade. You are solely responsible for all of your own trading decisions.