 |
| Gold V.1.3.1 signal Telegram Channel (English) |

USDJPY: Break Below 153 Highlights Intervention Risk Amid Fed-BoJ Policy Divergence
2026-01-28 @ 11:02
Over the past 24 to 48 hours, the USD/JPY exchange rate experienced notable volatility, sliding from yesterday’s closing level of around 152.83 to below 153, reaching a low near 152.21. This movement was primarily driven by divergence in policies between the Federal Reserve and the Bank of Japan, alongside rising speculation of yen intervention. The market’s growing appetite for the yen as a safe haven, coupled with a weaker dollar amid increasing US political and economic uncertainties, pressured the USD/JPY pair downwards.
Recent market news highlights the increased likelihood of Japanese government intervention to support the yen, which weighed heavily on the USD/JPY exchange rate falling below the 153 level. Investors remain highly attentive to policy signals from both central banks. Moreover, rising fiscal and political risks in the US further diminished the dollar’s appeal. For the average investor, this price action reflects the heightened risk and volatility inherent in the currency markets, emphasizing the need for careful consideration of US policy risks and the yen’s safe-haven status to make more informed forex decisions.
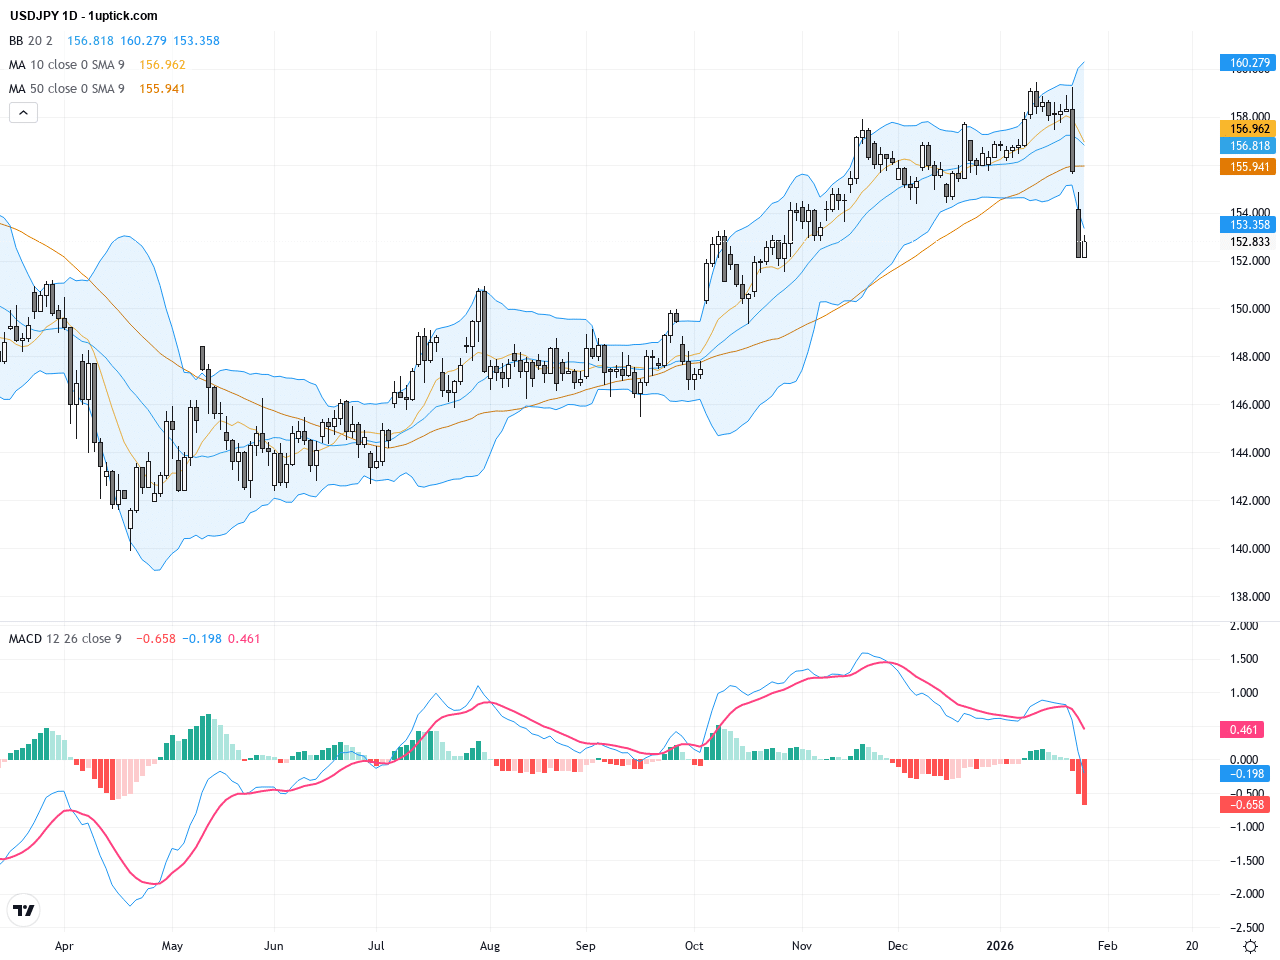
The daily chart shows USDJPY declining sharply from the 153 range in recent days, breaking below the 50-day moving average of 156.49 while remaining above the 200-day average of 149.65. The Bollinger Bands are narrowing with a clear lower band support, and the MACD has formed a bearish crossover, indicating weakened momentum and a predominantly bearish mid-to-long-term trend. The price is now challenged by the technical resistance zone around 152-153, signaling potential continued downside until new support is found.
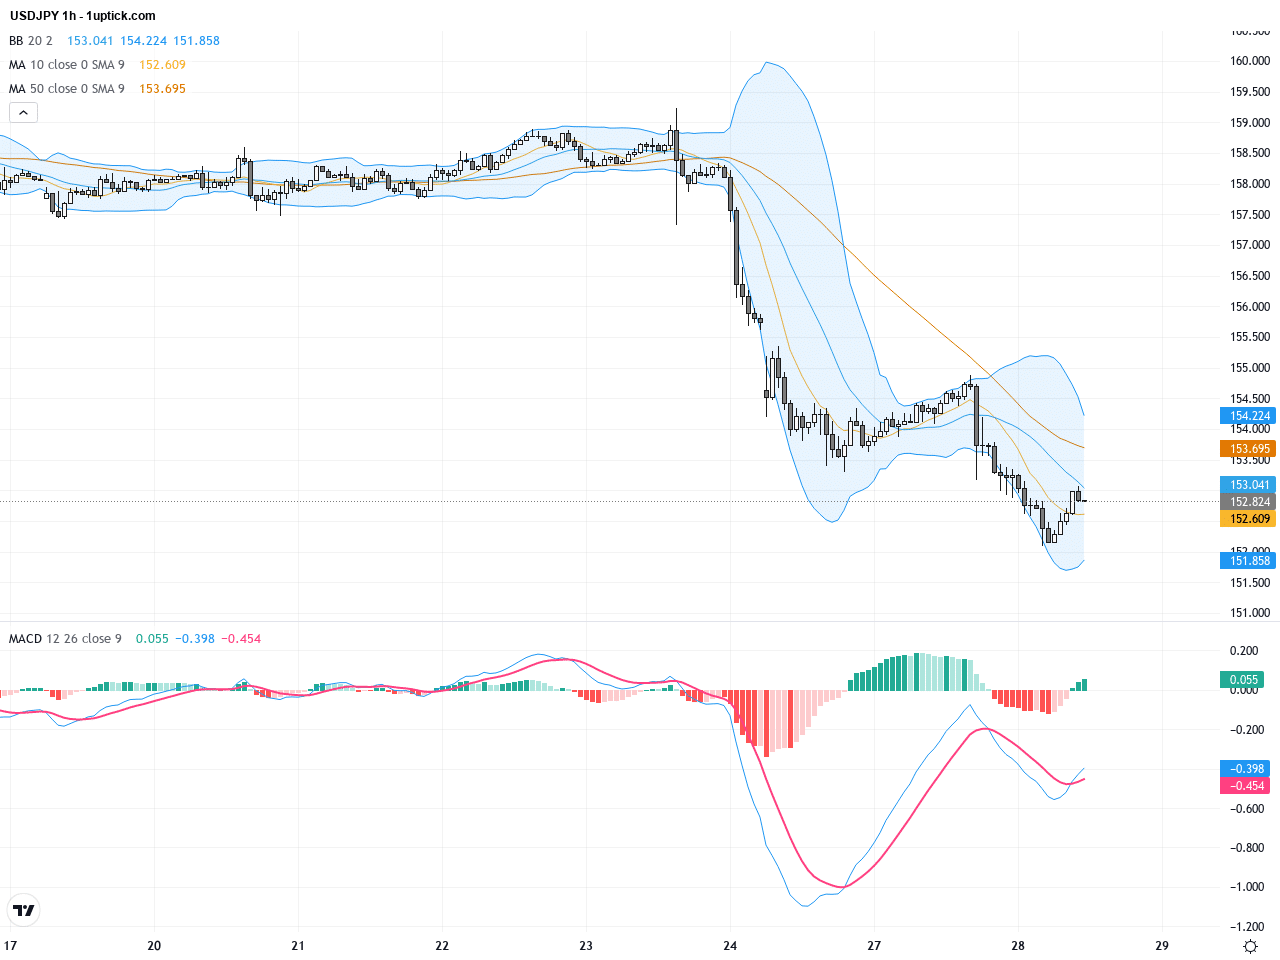
On the 1-hour chart over the past 4-5 days, USDJPY exhibits increased volatility with testing of the 152 to 153 range. The 5- and 20-hour moving averages have formed a bearish crossover, and price action stays mostly below the middle Bollinger Band. The RSI is near oversold territory around 30, suggesting a possible short-term rebound, though the MACD histogram remains negative and volume weak, implying sustained downside pressure. Traders should monitor whether support near 152.50 holds or if momentum accelerates lower.
Technical Trend: Short-term trend: Cautiously Bearish with a technical retracement underway. Medium-to-long term: Sideways with bearish bias and increased volatility.
Technically, USDJPY is forming a short-term bearish flag consolidation within an ongoing downtrend, reflecting temporary price correction amid seller dominance. The recent bearish engulfing candlestick signals stronger selling pressure with potential continuation in the next 24 hours if the lower boundary of the flag is breached. Combined with the MACD bearish crossover and RSI near 30, short-term downside momentum remains firm. However, intervention risks loom large, as a drop below the crucial 153 psychological level could trigger Japanese authorities to step in, causing sudden volatility spikes and possible technical disruption.Today’s economic calendar highlights the Bank of Japan December minutes release at 00:50 GMT+1 and the US Federal Reserve’s January interest rate decision and press conference at 20:00 and 20:30 GMT+1 respectively, as the most impactful events for USDJPY. These key central bank updates are likely to drive significant volatility in the pair, making it essential for traders to closely follow their outcomes to gauge directional bias.
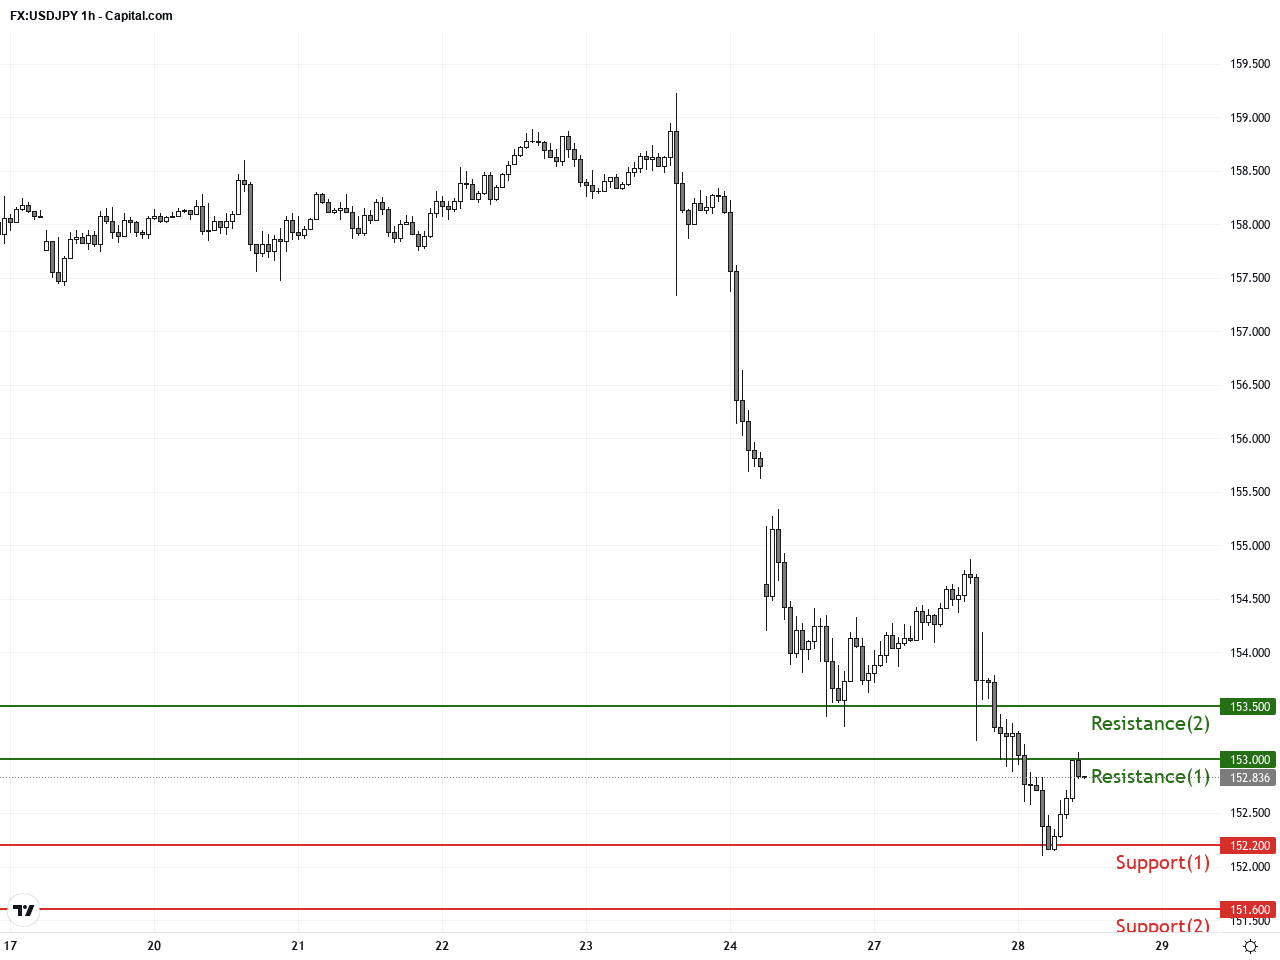
Resistance & Support
The above financial market data, quotes, charts, statistics, exchange rates, news, research, analysis, buy or sell ratings, financial education, and other information are for reference only. Before making any trades based on this information, you should consult independent professional advice to verify pricing data or obtain more detailed market information. 1uptick.com should not be regarded as soliciting any subscriber or visitor to execute any trade. You are solely responsible for all of your own trading decisions.