


 |
| Gold V.1.3.1 signal Telegram Channel (English) |
USDJPY Technical & Fundamental Analysis: Yen Intervention Risk Drives Market Pressure
2026-01-27 @ 03:00
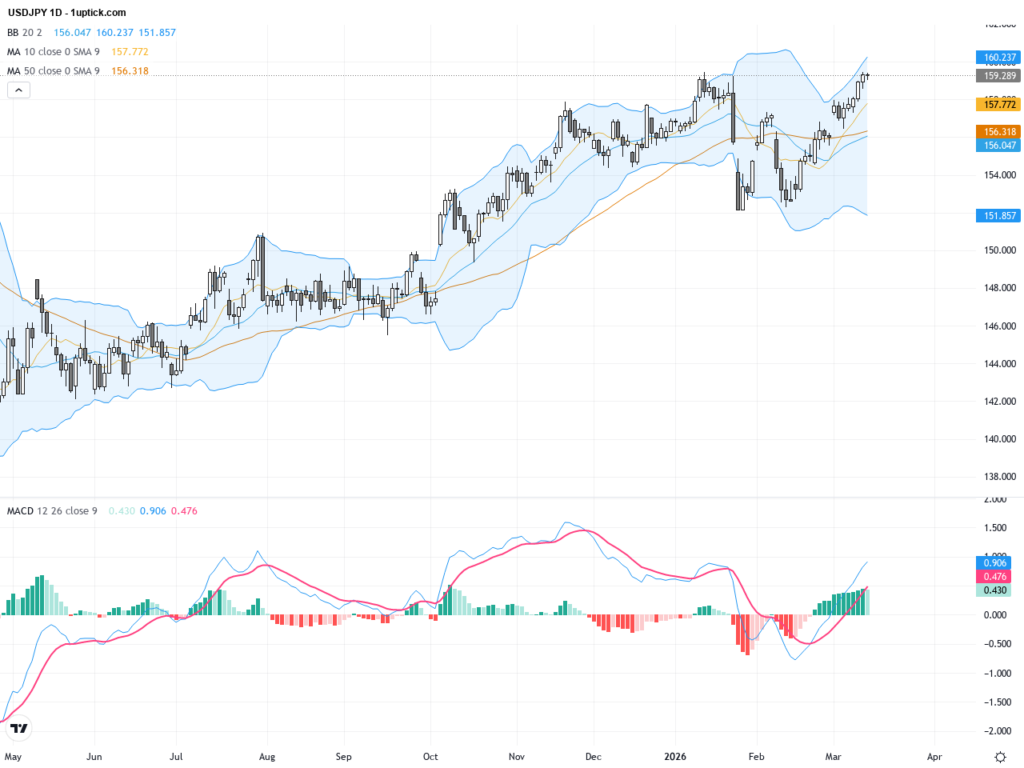
Over the past 24 to 48 hours, the USD/JPY has remained under pressure, trading near November lows. Yesterday’s closing price was 155.74, while recent data shows the rate dropping to around 154.17. The heightened volatility is driven by multiple factors including market speculation about potential intervention by the Bank of Japan and upcoming Federal Reserve decisions.
Reports have surfaced that both the U.S. Federal Reserve and Japanese authorities may consider currency intervention akin to the 1985 Plaza Accord, which dramatically weakened the dollar against the yen by approximately 50%. This suspicion has triggered a sharp selloff in the dollar, marking its worst two-day drop since April 2025. Additionally, Goldman Sachs highlighted that beyond policy actions, shifts in fiscal expectations and a narrowing US-Japan interest rate differential are key supports for the yen.
For the average investor, this means increased instability in the USD/JPY exchange rate, with potential for significant swings driven by policy moves. Monitoring upcoming Federal Reserve policy announcements and any confirmation of yen intervention will be critical, as these events will directly influence forex market sentiment and price direction.

The USDJPY daily chart reveals a clear downtrend from the recent high of 159.45 down to approximately 154.17. The 50-day moving average remains above the 200-day average, yet price has broken below the 50-day, signaling short-term bearishness. Bollinger Bands are contracting, hinting at upcoming volatility expansion. The MACD indicator shows a bearish crossover with negative histogram bars, confirming strengthening downward momentum. Overall, the daily chart points to continued correction with resistance near the 50-day MA and key support around 151.0.
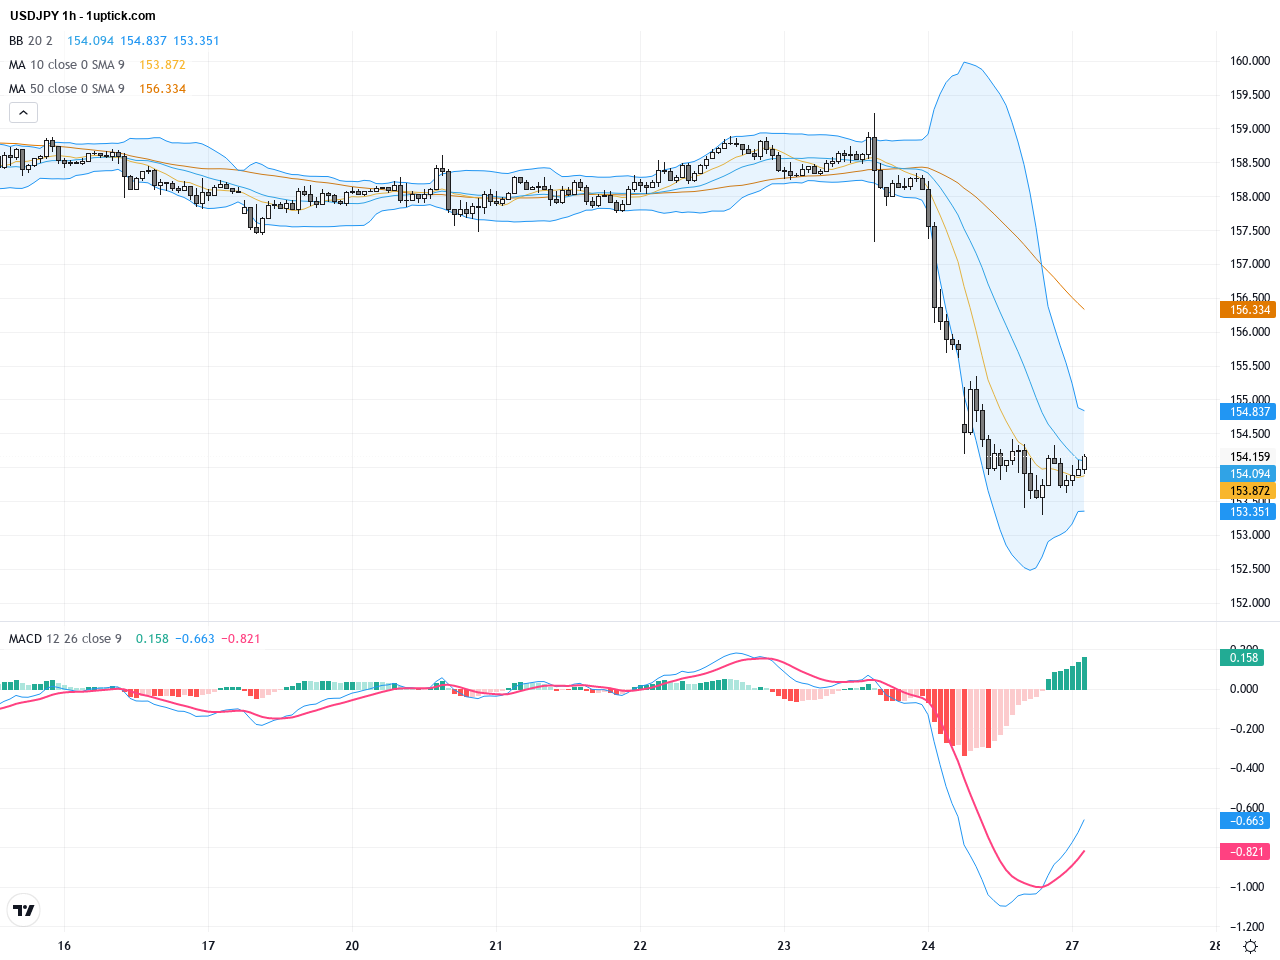
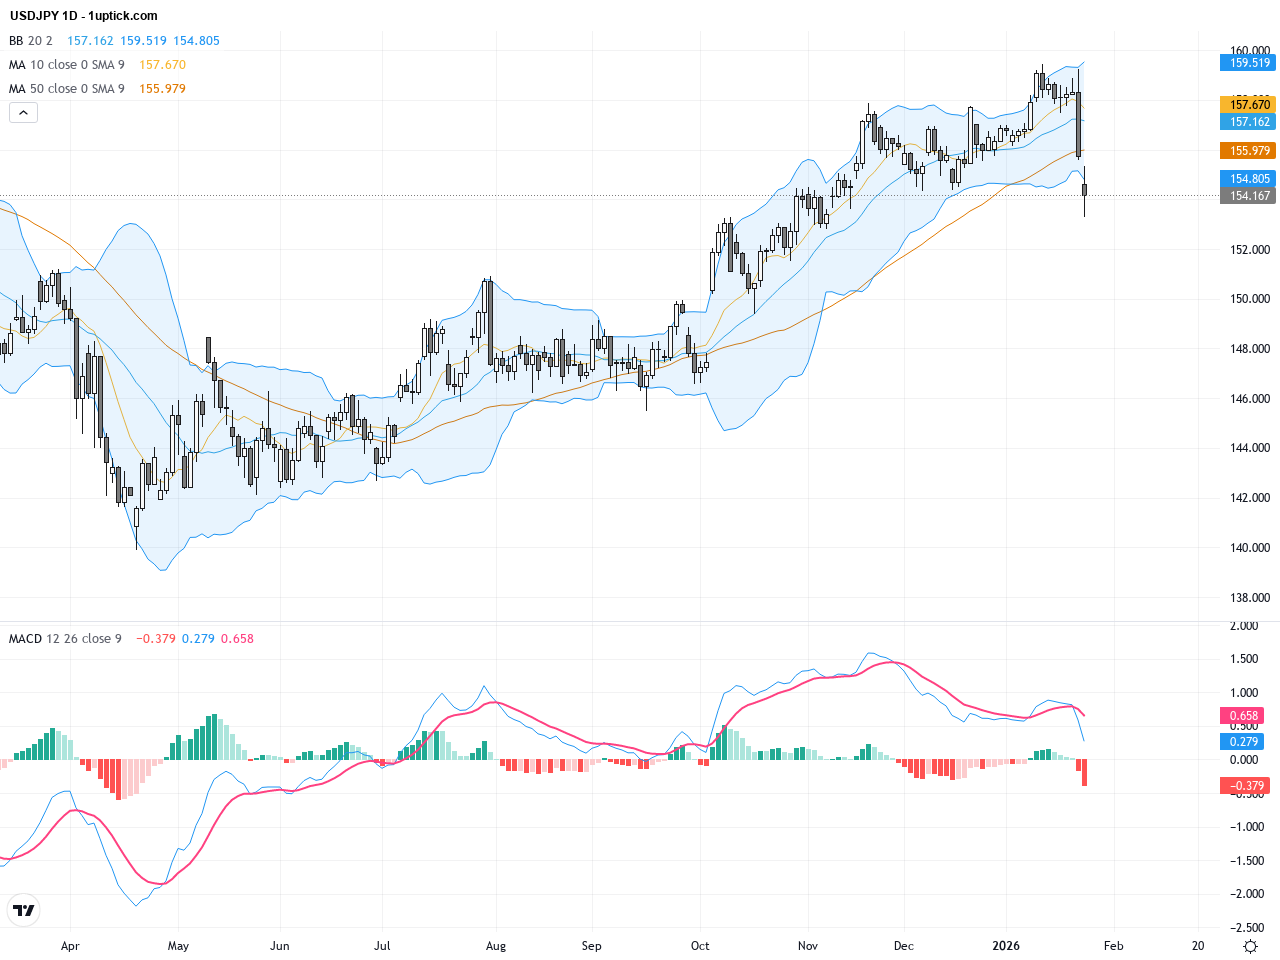
The hourly chart over the past 3-5 days reflects a pronounced bearish consolidation in USDJPY. Short-term moving averages like the 20 and 50-period have formed a bearish crossover, with price consistently below the 20-period MA. Bollinger Bands have shifted lower, indicating intensified selling pressure. MACD shows bearish momentum and RSI nears oversold territory, suggesting a potential short-term rebound is possible. However, the overall trend remains downward, supported by a descending channel pattern. Traders should be cautious about false breakouts.
Technical Trend: USDJPY is currently in a cautiously bearish trend with no clear signs of reversal in the near term.
Technically, USDJPY’s daily chart shows a persistent downtrend with MACD bearish crossover and contracting Bollinger Bands confirming strong selling pressure. The hourly chart’s short-term bearish cross and RSI near oversold signal a possible brief corrective bounce. However, the dominant risk lies in sensitive market reactions to potential Japanese currency intervention announcements, which could trigger sharp reversals. Traders should watch the 154 level carefully as a crucial support; a break below may deepen the correction.Key economic data released today in GMT+1, such as Germany’s Ifo Business Climate and Poland’s Retail Sales, have limited direct impact on USDJPY, which is primarily influenced by US economic data and Bank of Japan policy. The US Durable Goods Orders scheduled at 16:00 GMT+1 could influence the dollar: a stronger-than-expected print may support the USD, while weaker results could further pressure USDJPY. No immediate economic events stand to reverse the current downward pressure; focus remains on the Fed decision.
Resistance & Support

The above financial market data, quotes, charts, statistics, exchange rates, news, research, analysis, buy or sell ratings, financial education, and other information are for reference only. Before making any trades based on this information, you should consult independent professional advice to verify pricing data or obtain more detailed market information. 1uptick.com should not be regarded as soliciting any subscriber or visitor to execute any trade. You are solely responsible for all of your own trading decisions.