


 |
| Gold V.1.3.1 signal Telegram Channel (English) |
WTI Crude Oil: Geopolitical Risks and Supply Concerns Drive Strong Break Above $60
2026-01-14 @ 05:21
Over the past 24 to 48 hours, WTI Crude oil has seen marked volatility, closing at $61.03 on January 13, up over $1.7 from $59.32 the day before, showing a clear rebound. The key drivers behind this price surge stem from escalating tensions in the Middle East and increased US tariffs on countries doing business with Iran, stirring supply risk concerns and pushing prices higher. The US President’s further support of protests within Iran has added to geopolitical uncertainties, helping oil prices surpass the $60 mark.
Additionally, analysts from CIBC forecast a wider discount on Alberta’s heavy crude this year due to the US plans to revive Venezuela’s struggling oil industry. This suggests more discounted heavy crude could enter the US market from Venezuela, putting downward pressure on WTI prices and widening the discount compared to the global Brent benchmark to an eight-month high.
For the average investor, these price swings demonstrate how global political and economic events directly impact the energy market. It’s not just a simple matter of supply and demand but also how geopolitical risks and policy moves drive price action. Investors in WTI should closely monitor developments in the Middle East and changes in US geopolitical strategies, as these factors are likely to continue shaping oil prices going forward.

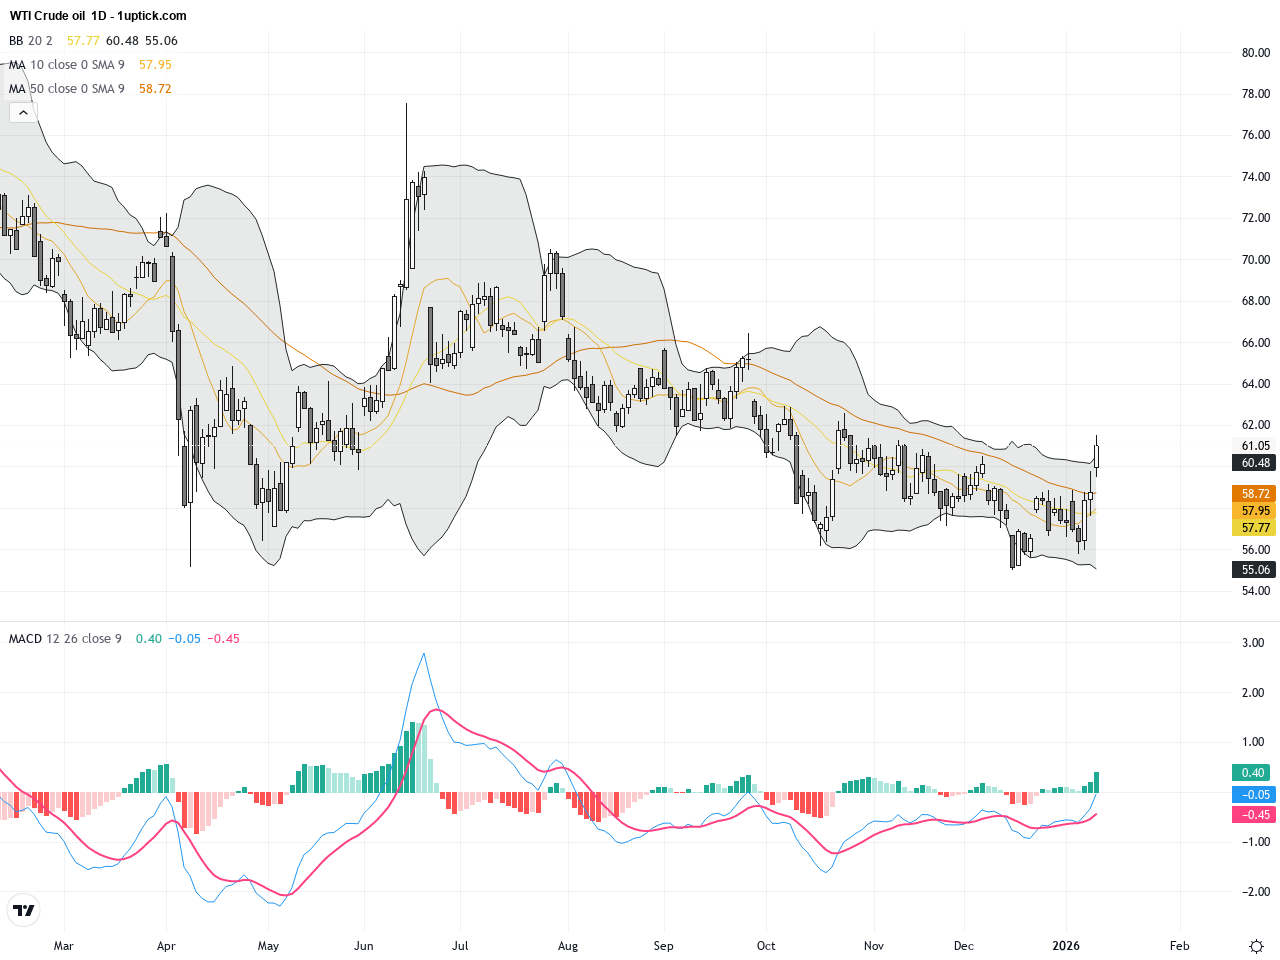
The daily chart shows a clear uptrend since late 2025, with prices consistently above the 50-day and 100-day moving averages, indicating strong bullish momentum. WTI recently broke above the $60 resistance level, triggering an expansion in the upper Bollinger Band and increased volatility. The MACD displays a bullish crossover with expanding green bars, supporting further upward movement. Overall, the daily technicals affirm a bullish bias for WTI Crude Oil.
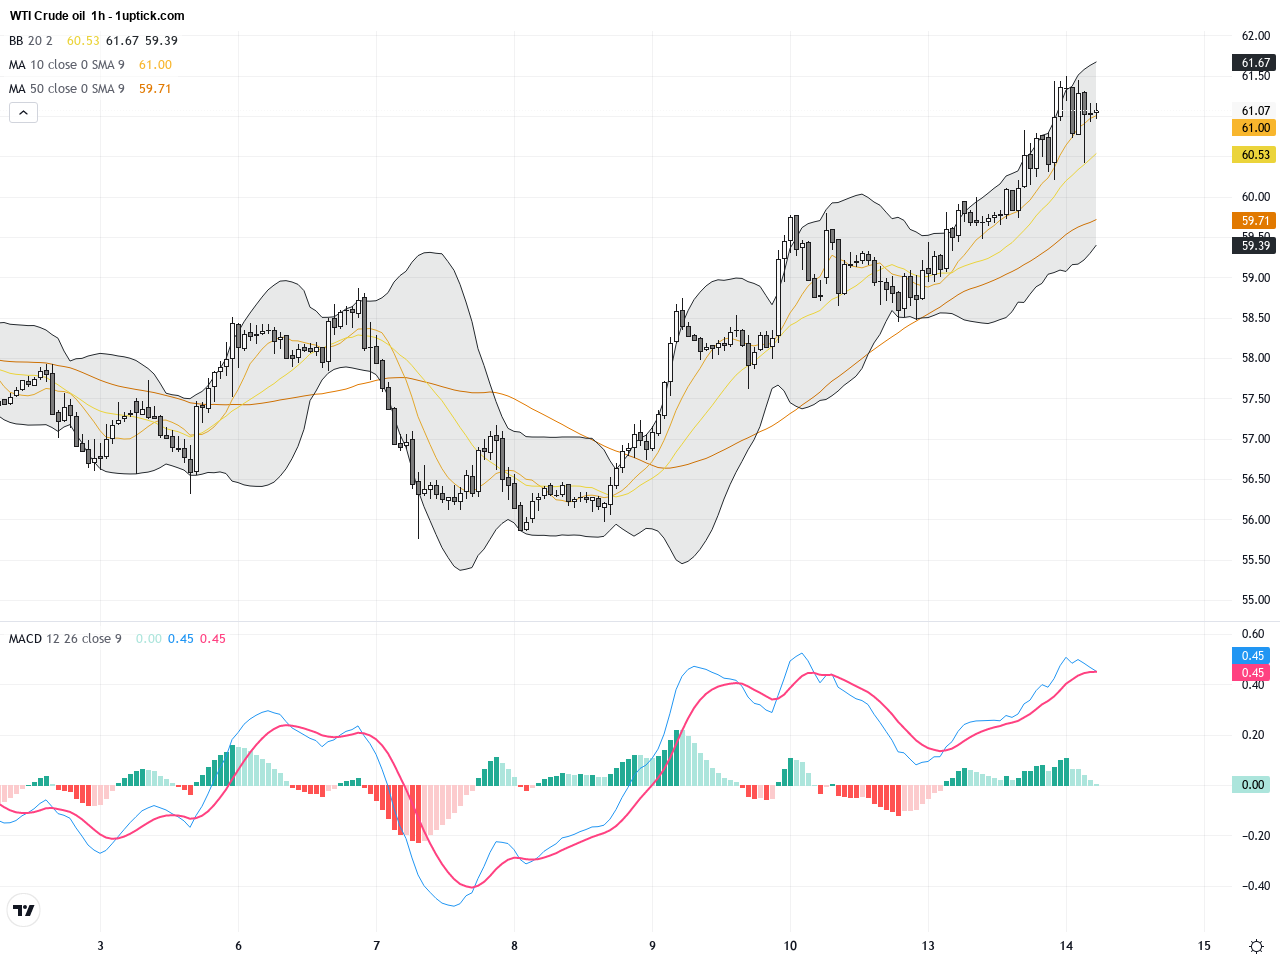
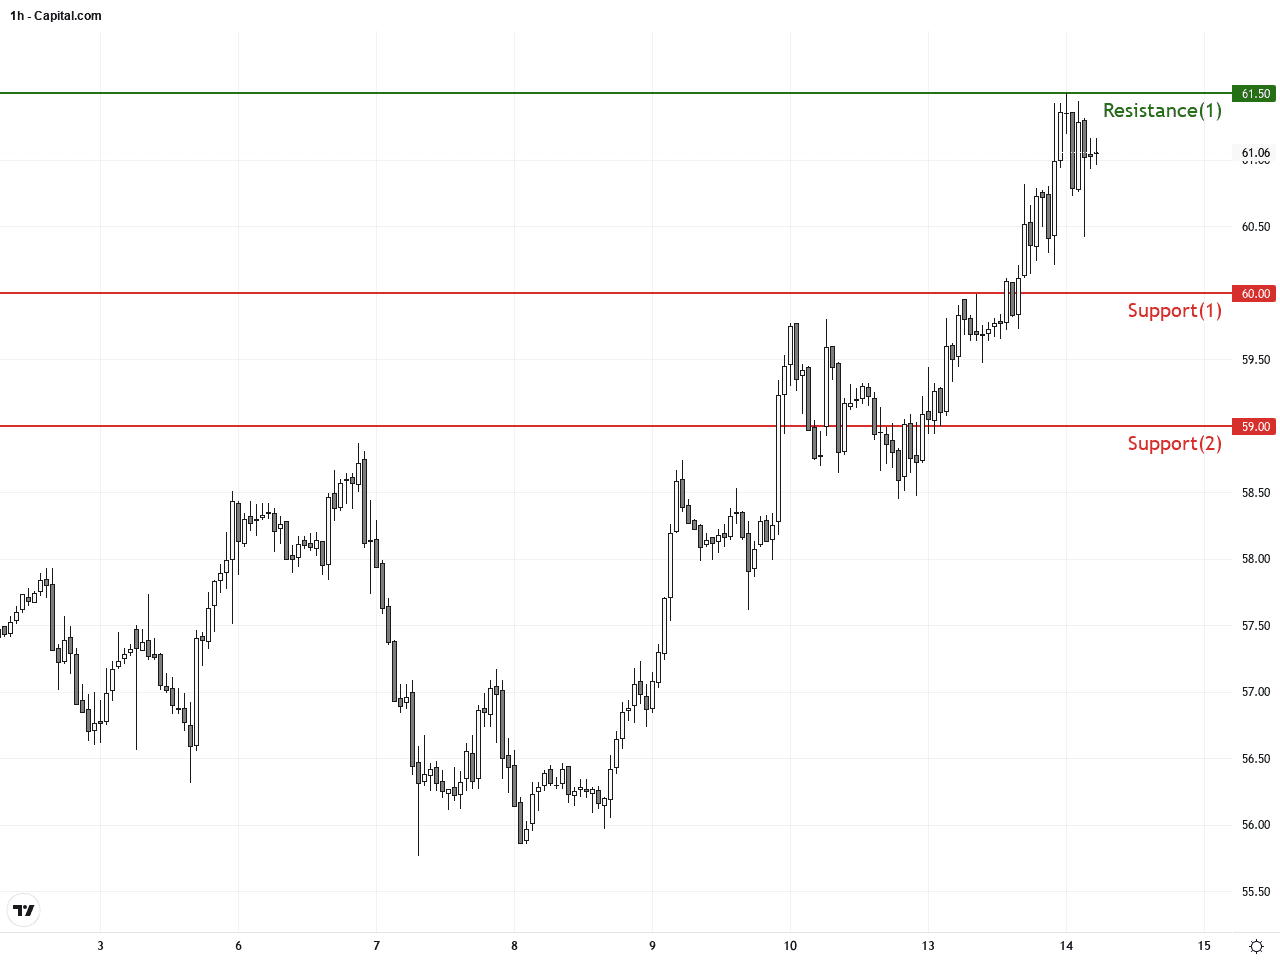
Over the past 3-5 days on the hourly chart, WTI has formed an upward channel with support near $60 and resistance around $61.5. Short-term price action remains above the 20- and 50-period moving averages, and the Bollinger Bands have begun to widen after a period of contraction, suggesting an imminent larger move. The hourly MACD shows bullish momentum, though the RSI near 70 hints at possible short-term overbought conditions. A flag pattern is visible, which if broken, could signal a fresh rally in the short term.
Technical Trend: WTI Crude Oil currently exhibits a clearly defined and confident uptrend, bolstered by technical momentum and geopolitical supply concerns supporting strong price advances.
Technically, WTI’s breakout above the psychological $60 mark is supported by strong momentum indicators such as the MACD bullish crossover and expanding Bollinger Bands on the daily chart. The hourly chart suggests potential short-term consolidation due to RSI overbought signals, with key focus between $60 and $61.5 resistance. Combined with geopolitical risk factors, the bullish trend remains intact. Traders might look for buy opportunities on dips to support levels while maintaining tight stops to manage risk from sudden downside shocks.There are no significant economic events scheduled today that directly impact WTI Crude Oil. Traders should continue to monitor geopolitical developments and supply-side news for major price drivers.
Resistance & Support
The above financial market data, quotes, charts, statistics, exchange rates, news, research, analysis, buy or sell ratings, financial education, and other information are for reference only. Before making any trades based on this information, you should consult independent professional advice to verify pricing data or obtain more detailed market information. 1uptick.com should not be regarded as soliciting any subscriber or visitor to execute any trade. You are solely responsible for all of your own trading decisions.